
A Tough Week For Stocks!
It's not my intention to report on every squiggle of the stock market but this past week was tough, so I think a quick review and comment is warranted.
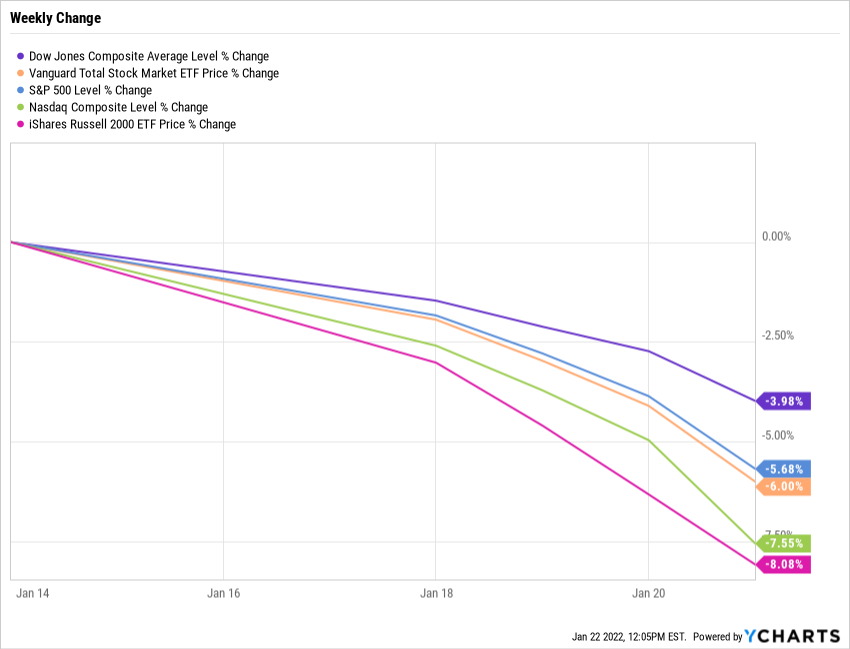
As you can see from the chart above, U.S. stocks fell sharply last week. The S&P 500 was down 5.7%, the NASDAQ Composite fell 7.6%, and the Russell 2000 index of small cap stocks dropped 8.1%. The Dow Jones Industrial Average was a champ as it declined just 4.0%.
The year-to-date numbers are worse:
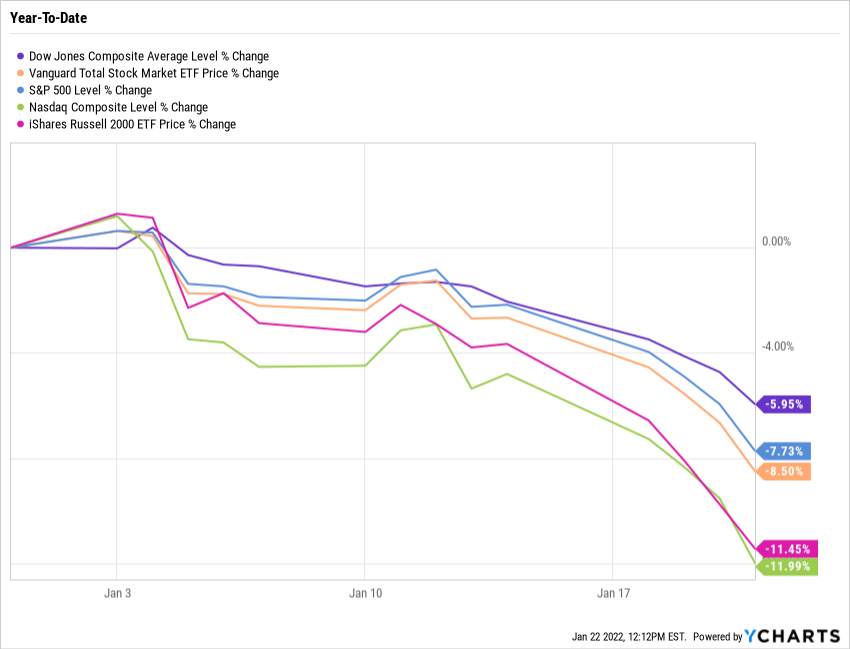
Why is this happening? The market has had a terrific run since the late winter of 2020 without a significant correction. But now, inflation is soaring, interest rates are rising, earnings reports are, so far, uninspiring, and valuations are high. All good reasons for taking profits I suppose. In addition, this week's performance may have been "enhanced" by trading related to the January 21 options expirations. (And Netflix didn't help matters! See below.)
Where does this leave our favorite indicators? I think fundamentals are still ok. The economy is growing, earnings are rising (perhaps not as fast as some might have hoped), and credit is available (and still fairly cheap). Valuations are still high but lower than at the start of the year. These two factors don't give me too much alarm.
Momentum, however, has begun to work against the investor as this correction deepens. The S&P 500 is now trading below both its 50 and 200-day moving averages. Many traders view this as a sell signal. I prefer looking at a longer-term moving average to gauge the market's overall direction. Currently, the S&P 500 is trading above both its 10 and 20-month moving averages as they have been since March 2020 indicating that the long-term uptrend for stocks is still intact. This suggests to me that the market is experiencing a correction and not (yet) entering a bear market. However, I would become more concerned if the S&P 500 fell below the 10 and 20-month moving averages (now at 433.3 and 400.1 respectively) and the slope of those averages turned negative. Let's see where we are at the end of the month...
You can monitor the three factors of fundamentals, valuation, and momentum in the Market Laboratory. Remember to click on the captions below each graph to get the most up-to-date version.
Fourth Quarter Earnings Reports Are Starting
Some of the big banks, JPMorgan, Wells Fargo, and Citigroup reported their results on January 14. While on paper all three exceeded expectations, Citigroup and JPMorgan shares fell as investors focused on the likelihood of slower growth in 2022 and beyond. This article from the Wall Street Journal goes into greater detail, Pandemic Profits Begin to Ebb at America’s Biggest Banks
Reports began in earnest this holiday shortened week. I have found this page on Investing.com that lists all the earnings reports by date. You can sort alphabetically or by market cap (I recommend largest to smallest). Results higher than forecast will be shown in green, lower than forecast in red. There is a lot more you'll want to know behind those numbers, some of which you can find by clicking on the symbol.
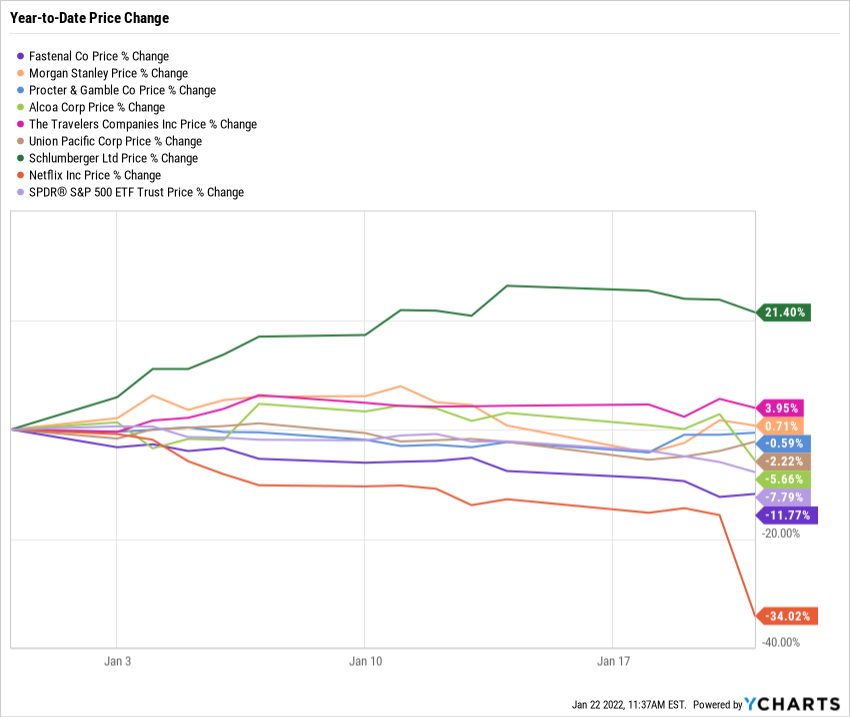
Here are some of this week's highlights...
After the rocky start for the big banks last week, Morgan Stanely bucked the trend reporting strong earnings and a decent outlook on Wednesday. The stock responded with healthy gains.
Household products giant, Proctor & Gamble posted solid results despite pressure on gross margins from rising costs. The company raised forecasts for 2022 driven by expectations of higher unit sales and price increases to offset cost pressures.
The industrial fastener company, Fastenal, also reported a good quarter, slightly exceeding investor expectations. Rising volumes, higher prices, and effective supply chain management were key drivers. Fastenal provides a great window into industrial activity as their products are used just about everywhere. When they are doing well, the economy is probably ok.
Other companies with notable positive results included Alcoa, Travelers, Union Pacific, and Schlumberger.
And then there was Netflix...
Despite stronger than expected earnings, shares of Netflix collapsed, falling $110.75 to $397.50 per share or -21.8%. Investors were spooked by the company's expectation of dramatically lower subscriber growth (say 60% less than what was expected) in the first quarter of 2022. This article from the Wall Street Journal goes into more depth: Netflix Shares Sink as Company Sees Subscriber Growth Slowing
Inflation Watch
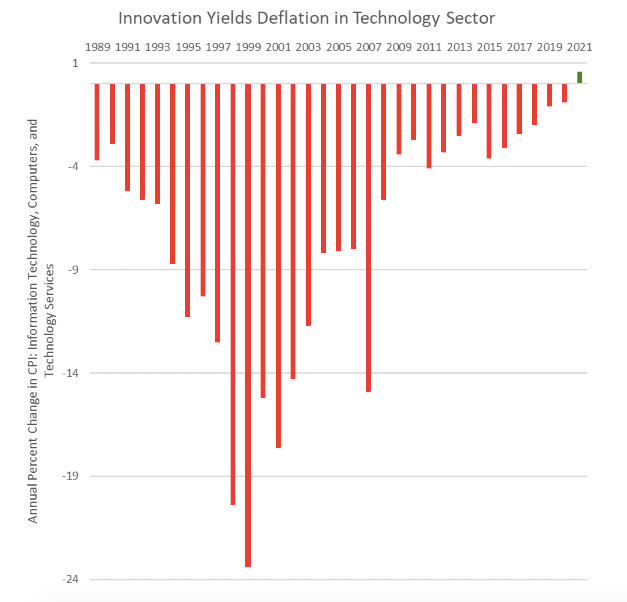
For more than 30 years technology innovation has resulted in downward pressure on prices. This has helped keep inflation under control, particularly as the tech sector has grown in importance to our economy. Disturbingly, it appears this trend is reversing. As you can see in this chart, the tech sector experienced inflation in 2021. Given the shortage of semiconductor chips, rising labor costs, tensions between China and Taiwan, it seems reasonable to expect more inflation in the tech sector in 2022 and thus more upward pressure on the CPI overall.
Why does this matter? Take a look at this scatterplot comparing CPI and P/E ratios:
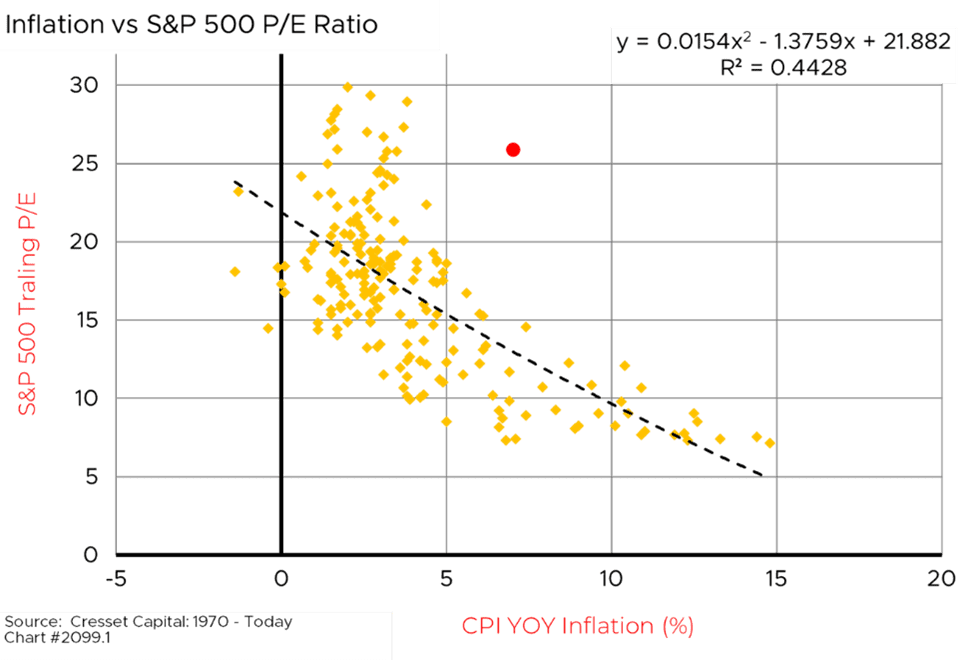
While an R-squared of 0.44 isn't a particularly strong correlation, I think the picture shows a pretty clear relationship between P/Es and the CPI. When the CPI is less than 5% the P/E ratio is all over the map, ranging from 10x to 30x. However, as inflation increases above 5%, P/E ratios fall, ranging from 7x to 15x. The red dot, where we stand today, is a clear outlier. It suggests the market is vulnerable to a fall in valuations with much of that risk probably concentrated in the very highly valued tech shares and other high multiple growth stocks. (See Netflix above!)
A Primer On Closed-End Funds
This Wall Street Journal article, Wilmot Kidd, Meet the Kidd Who Goes Toe to Toe With Warren Buffett, inspired me to write this quick primer on closed-end mutual funds (CEF). CEFs, such as the one managed by Wilmot Kidd, can be a great choice for your portfolio. However, CEFs are not as well-known as their mutual fund siblings, open-end mutual funds and exchange-traded funds.
Here are a couple of key differences:
Open-end and exchange-traded fund shares are continuously offered and redeemed. Purchases increase the number of outstanding shares, while sales decrease them. A closed-end fund, on the other hand, issues a set number of shares through an initial public offering. The number of CEF shares outstanding does not change when you buy or sell them.
Every year, open-end and closed-end mutual funds must pay out all of their net income (dividends and capital gains). This can sometimes complicate tax planning and potentially reduce the after-tax return of the investment. ETFs rarely pay capital gains dividends given their unique structure. Thus, capital gains taxes are only incurred when you sell ETF shares which can be very helpful for tax minimization strategies.
Traditional open-end mutual funds are bought and sold at the end of the day at the fund's net asset value leaving the investor guessing the exact price paid (or received) for their shares until the next day. (In rare circumstances, open-end mutual funds can delay the redemption of shares.) Closed-end funds, like ETFs, trade on an exchange throughout the day, prices rising or falling based on investor demand for the fund, thus the investor knows the transaction price immediately and the trades settle just like common stock.
Unlike ETF's and open-end funds, the market price of a CEF can deviate from its net asset value, sometimes by wide margins. This premium/discount from its net asset value can provide an opportunity or a risk for the investor. Let's look at the fund Wilmot Kidd manages, Central Securities Corp (CET) as an example.
This is a chart of the last three years of closing prices (black) and the fund's net asset value (blue). As you can see, the NAV has been consistently higher than the market price. As of 1/14, the discount was 13.3%. In other words, you can buy the portfolio that Mr. Kidd manages for 13% less than if you were to replicate it on your own. Given the track record described in the Journal article, that sounds like it might be a pretty good deal, particularly if the discount narrows as it did for a time last year.
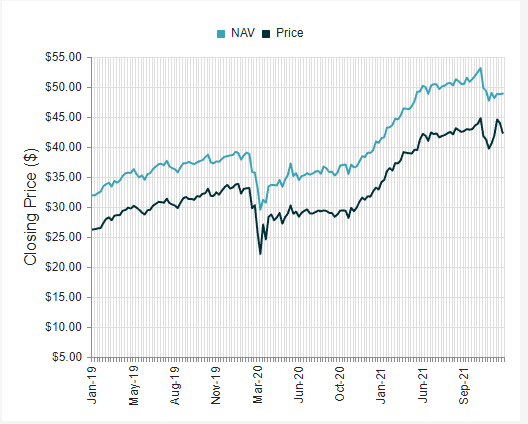
Now CET is clearly an example of a well-managed, low-cost fund that you can buy at a significant discount today.
Here's a similar chart of Gabelli Equity Fund (GAB). As you can see, over much of the past three years it has traded at a premium to its NAV. In this case, you are currently paying 12% more for the fund than you would have to pay if you replicated GAB's portfolio in your own account.
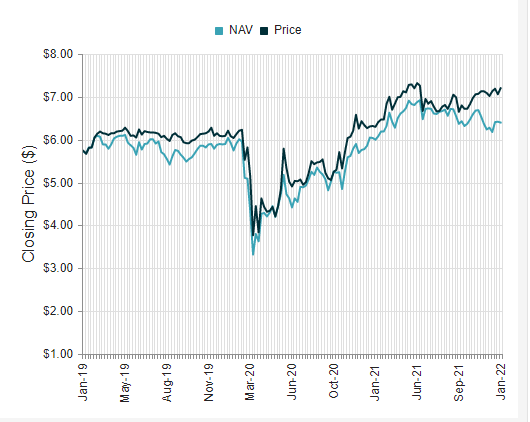
There may be a good reason to pay a slight premium for a well-managed fund. However, if you are considering or own a CEF that trades at a premium be aware, those premiums can evaporate quickly in a market downdraft.
ETFs are structured and managed so that the premium or discount to the net asset value is kept very small and relatively stable.
Closed-end funds come in a variety of strategies, equities, bonds, balanced, etc. Most are actively managed. Some employ leverage to increase their yields or enhance their performance. This also increases their risk profile. So unlike passive funds, there is much more to evaluate when considering a CEF.
One last consideration - avoid participating in the initial public offering of a CEF as the shares almost always trade to a discount (that is, fall in price) when they start trading - sort of like driving a new car off the dealer's lot and watching its resale value evaporate. Wait for the new fund to trade for at least a few weeks until the discount starts to stabilize.
If you want to learn more, check out CEFConnect.com
High-Yield Bonds - Be Careful!
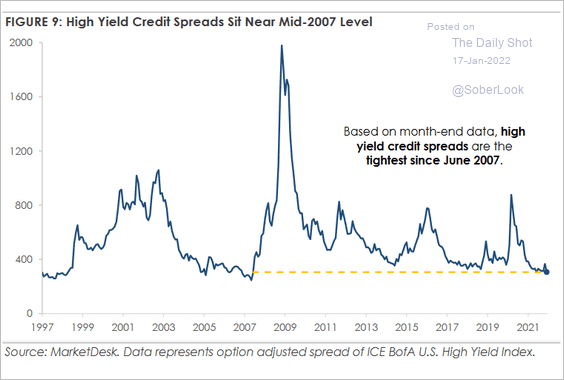
High-yield bonds, a.k.a. "junk" bonds, pay a higher rate of interest than investment grade bonds to compensate the investor for the increased default risk of the less credit-worthy issuer. The high-yield bond spread is the difference in the rate of interest on high-yield bonds and investment-grade corporate or Treasury bonds. As you can see in the chart below, the spread is less than 325 basis points (a basis point equals 0.01%). This is the lowest it has been since before the Great Recession of 2008-2009 when it hit a high of about 2,000 basis points. At the current spread, high yield bonds are looking relatively expensive and vulnerable to an interest rate or economic shock. Just look at what happened in the 2020 pandemic when the spread increased to over 800 basis points and high-yield bonds fell more than 20%.
Now, I'm not suggesting that high-yield bonds don't have a place in your portfolio. They offer an opportunity to earn more income than investment-grade bonds and potentially enjoy some capital gains. However, these bonds carry more default risk, are more volatile than investment-grade bonds, and often get hit when the stock market swoons.
Indeed, here is a chart comparing the performance of investment grade bonds (purple) and high yield bonds (yellow) this past week:
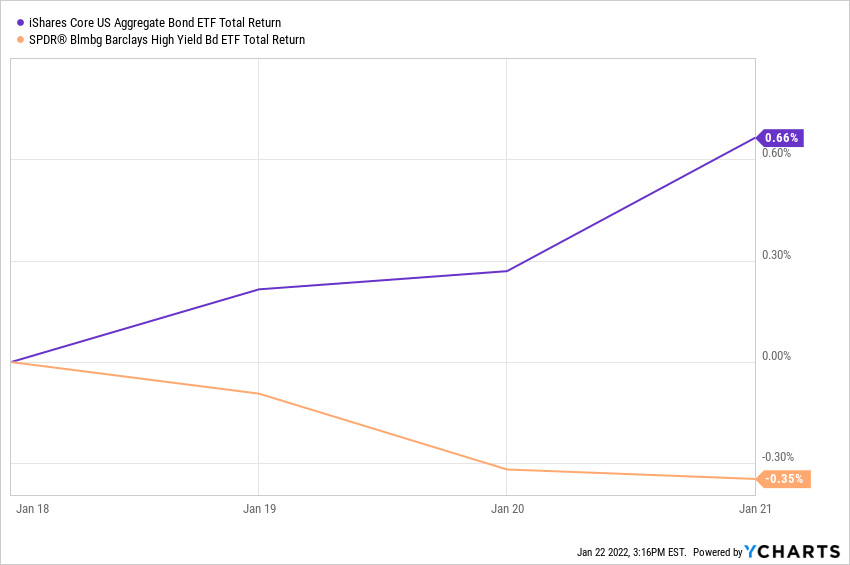
Ask yourself, are the risks worth 3% more income today? Perhaps, but be careful...
A Memo From Howard Marks
Howard Marks is out with his latest memo, Selling Out. In it, he considers one of investing’s most fundamental questions: when to sell. Marks explains that it’s foolish to sell because prices are up and because they’re down – and why, most of the time, staying invested is ultimately “the most important thing.”
If you wish to read more from Howard Marks, his books can be found in their own section in our bookstore. His memos can be found on the Oaktree Capital website. This link takes you directly to their Insights page.
Let The Wild Rumpus Begin
This is the title of GMO LLC Co-Founder and Investment Strategist Jeremy Grantham's latest report. Here is an excerpt from the Executive Summary:
Today in the U.S. we are in the fourth superbubble of the last hundred years. Previous equity superbubbles had a series of distinct features that individually are rare and collectively are unique to these events. In each case, these shared characteristics have already occurred in this cycle. The checklist for a superbubble running through its phases is now complete and the wild rumpus can begin at any time.
Grantham has been warning about a stock market bubble for some time. And he has been wrong, so far. However, his long-term record of wealth creation is exemplary which makes Let The Wild Rumpus Begin a must read.
A Little More On RMDs
FINRA, the organization that oversees U.S. broker-dealers, has an RMD calculator on their website here which you may find helpful in your RMD planning. It starts at age 72, the first year most of us will have to start withdrawals. When calculating your account balance be sure to include all your retirement accounts subject to the RMD. If you forget an account and as a result do not withdraw enough for your RMD, you will be subject to some potentially significant penalties.
Website News:
New links in the Market Laboratory including some interesting reports from Standard & Poors and some historical market data that you may find helpful. Scroll to the bottom of the page to check it out.
Links to 2022 market/economic outlook reports added in the articles section of The Archives.
More new books in The Bookstore.
And Finally,
Welcome new subscribers. Thank you! You can find previous newsletters and more information by heading over to our Home Page. And be sure to visit our Bookstore, Market Laboratory, Resources, and Archive pages.
Please feel free to forward this newsletter to a friend.
If you're not a subscriber and would like to be, just click the subscribe button. It's free! (Well, not exactly. After all, it does take several minutes of your valuable time to read. But we hope you will find spending that time worthwhile!)
I'm always interested in your feedback, ideas for topics, and questions. So please click the button below.
If for some reason the button doesn't work, please email us at: under.a.buttonwood.tree@gmail.com