
A new year begins! With it, investors partake in the annual ritual of reviewing their past year's performance and making forecasts for the future. I'm not a big fan of either. Performance reviews, while admittedly necessary, are tedious while even the best forecasts are likely to be wrong and if relied upon, may lead to less-than-desired results, However, despite my objections, let's start this year's ritual with a review of 2022.
For those of you who don't have the time or inclination to complete this review, here's the executive summary:
- 2022 was a terrible year for investors as the economy began to weaken, inflation soared, the Fed scrambled into action, and markets cratered around the world.
- 2023 will likely be more of the same, at least at the start of the year. Ever the optimist, I suspect by the second half of the year, markets will regain some footing with bonds and stocks beginning to rebound. Whether returns will be positive for the full year is anyone's guess at this point.
This all assumes, of course, that nothing unexpected happens...
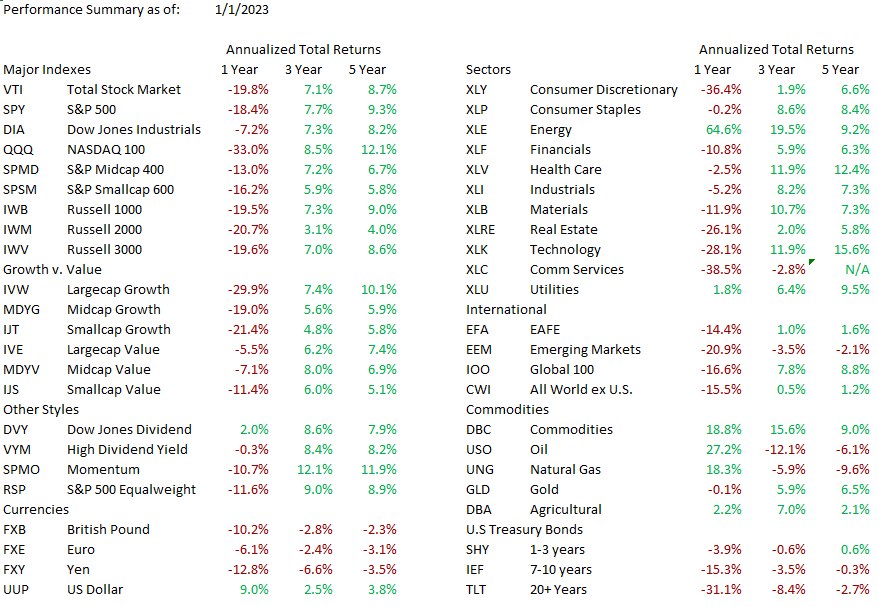
Unless you had a portfolio of 100% energy stocks you probably saw the value of your portfolio shrink in 2022. The table below clearly shows the carnage in almost every asset type.
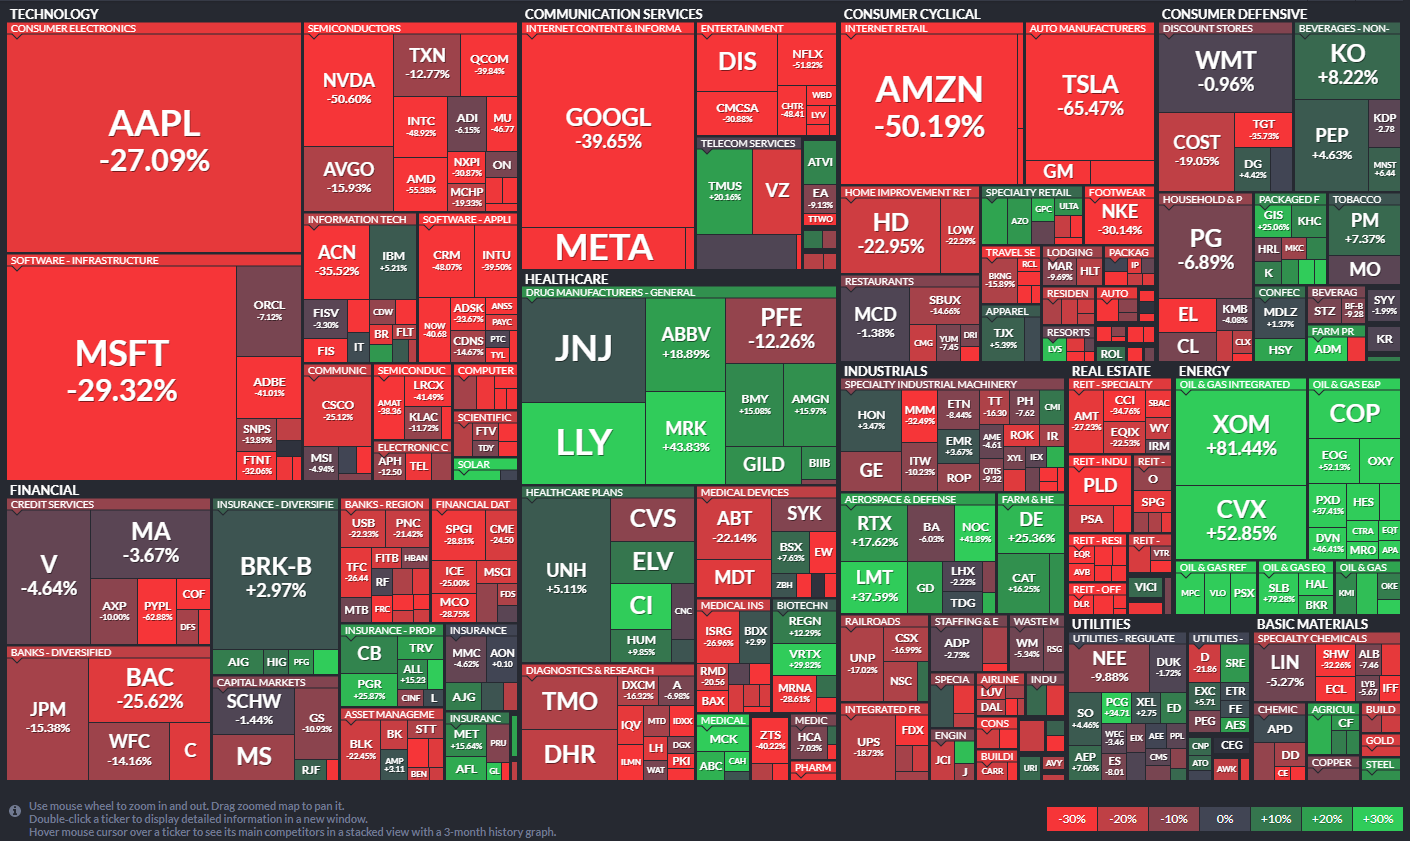
Here's a heatmap of the S&P 500's performance by stock last year.
Download more gory details if you dare:
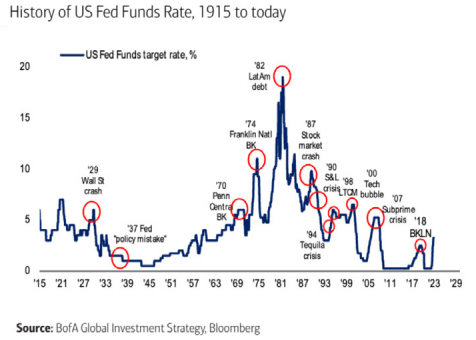
In fact, 2022 was a very unusual year as both stocks and bonds suffered significant declines. Indeed, 20+ year treasuries declined more than 30% (!) last year, much worse than the stock market. The chart below looks at the returns of the S&P 500 and 20+ year U.S. Treasury bonds during periods when the Fed was either raising or lowering the Fed Funds rate. Take a moment to focus on the periods of rising rates identified by the little red arrows at the bottom of the chart.
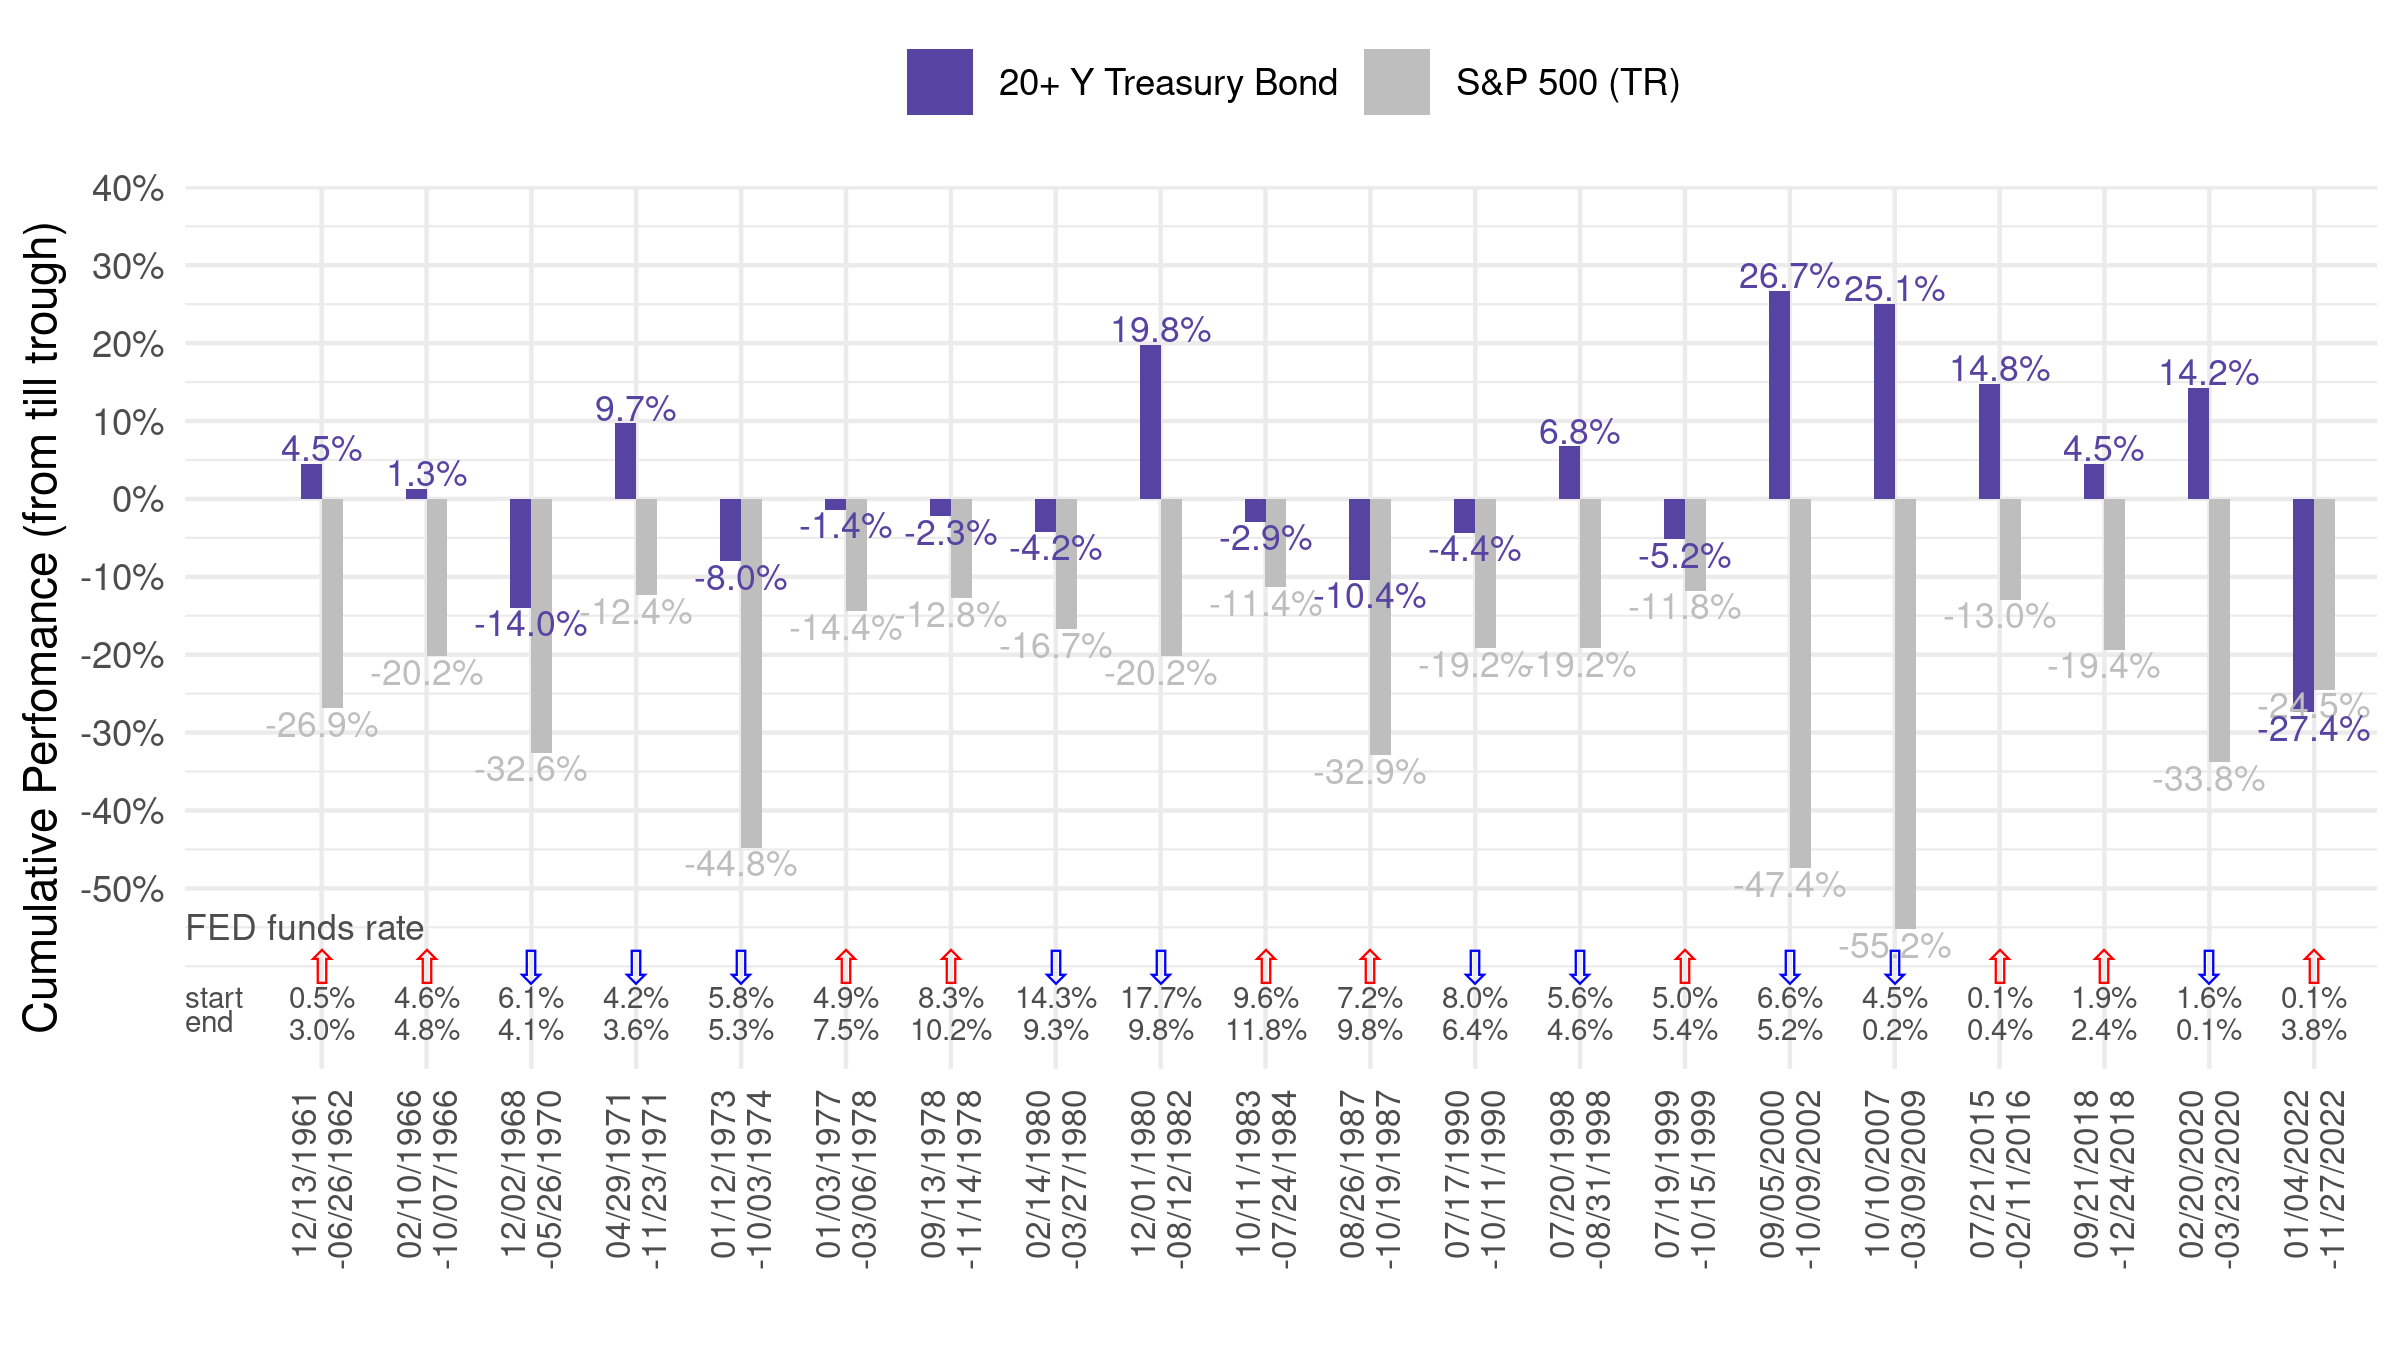
Not surprisingly, bonds and stocks declined in value during most of these periods of rising rates but until 2022 bonds always did better than stocks. However, in the current cycle bonds have performed worse than stocks, wreaking havoc on traditional 60/40 stock/bond portfolios. Vanguard's 60/40 Balanced Index Fund (VBINX) generated a total return of -17%, for example. While I suspect the traditional relationship between stocks and bonds (bonds are normally a risk modifier) will return soon, it will take some time for 60/40 portfolios to recoup their losses in 2022.
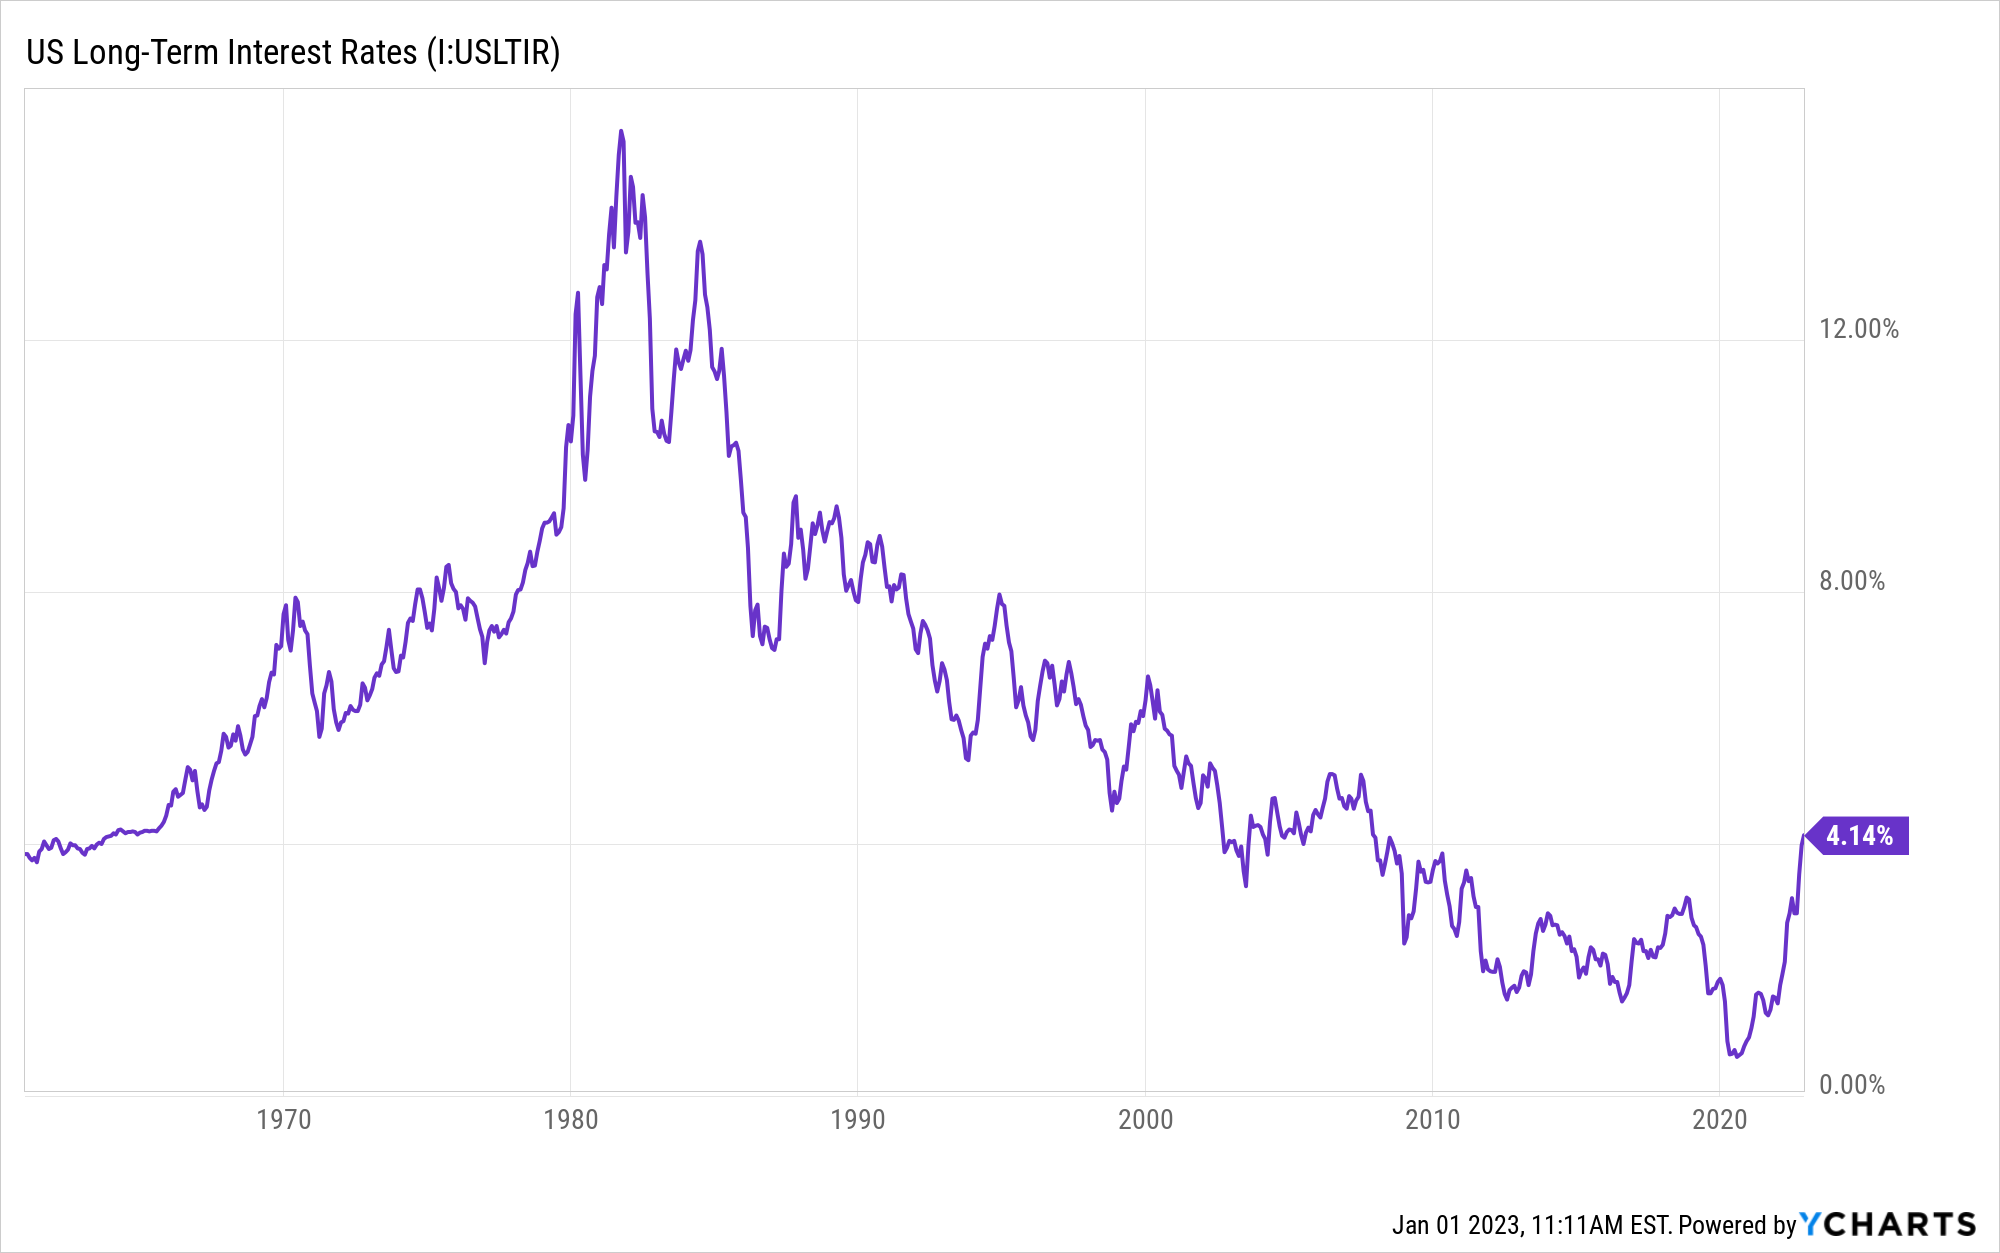
Why such a violent reaction in bonds? Remember that bond prices move inversely versus interest rates. The Federal Reserve was forced to aggressively hike short-term interest rates and take other measures to address accelerating inflation. As a result, long-term interest rates rose almost 600% (!) from a historically low rate of 0.60% in July 2020, to 4.14% today. Bond prices were crushed. Here's a 60-year history of those long-term rates:
Of course, rising interest rates did a number on stocks as well as bonds as this chart of the S&P 500, Fed Funds, and long-term rates shows. (Note the stock market peak when rates started to break out in January 2022.)
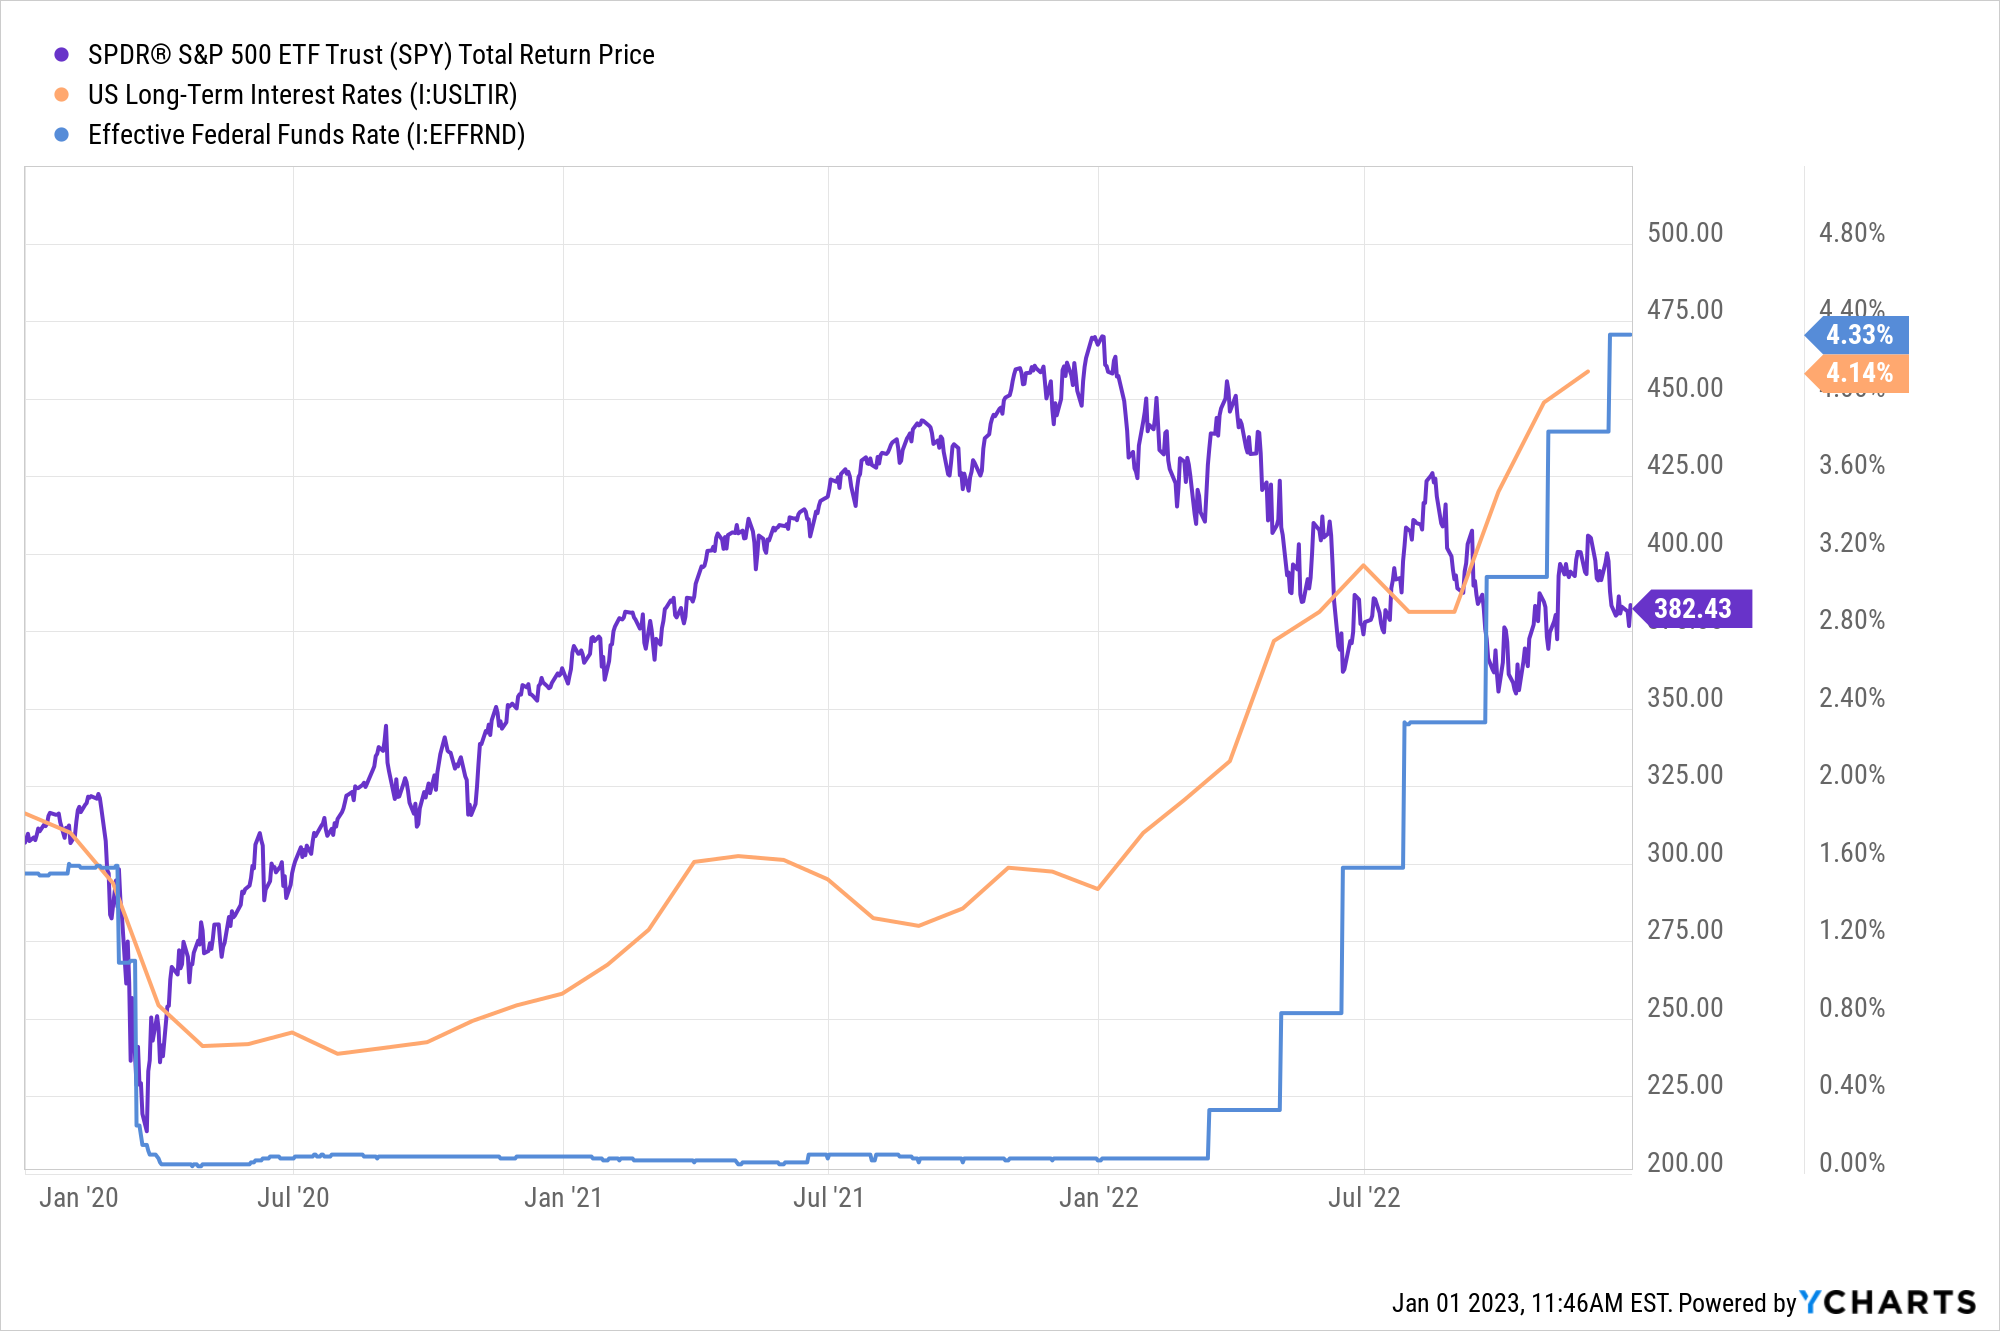
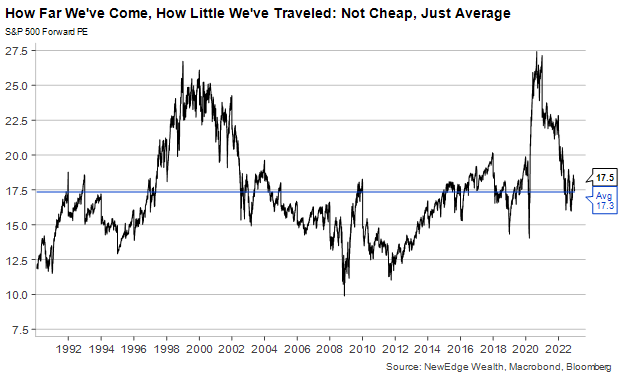
Rising rates can affect stocks in several ways. In 2022, the major effect was to cause valuations (ie. P/E ratios) to fall sharply. First, here's a chart of the P/E ratio of the S&P 500 showing its fall from a peak of 27x to 17x currently.
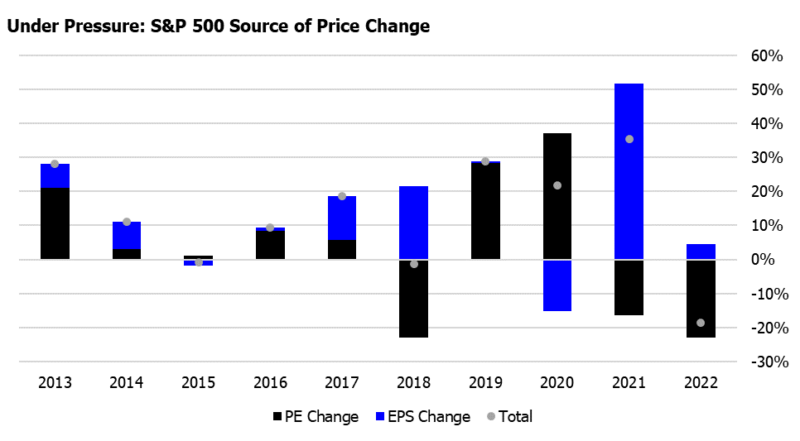
This second chart shows that despite rising earnings in 2022, stocks still fell as the P/E collapsed.
The Fed and other forces conspired to make 2022 a very forgettable year for investors. What about Main Street?
Fed rate hikes and other actions have an almost immediate impact on financial markets. Those same actions can take longer to impact Main Street. For example, the rate hikes in the second half of 2022 shown above will start to have an impact in the coming months.
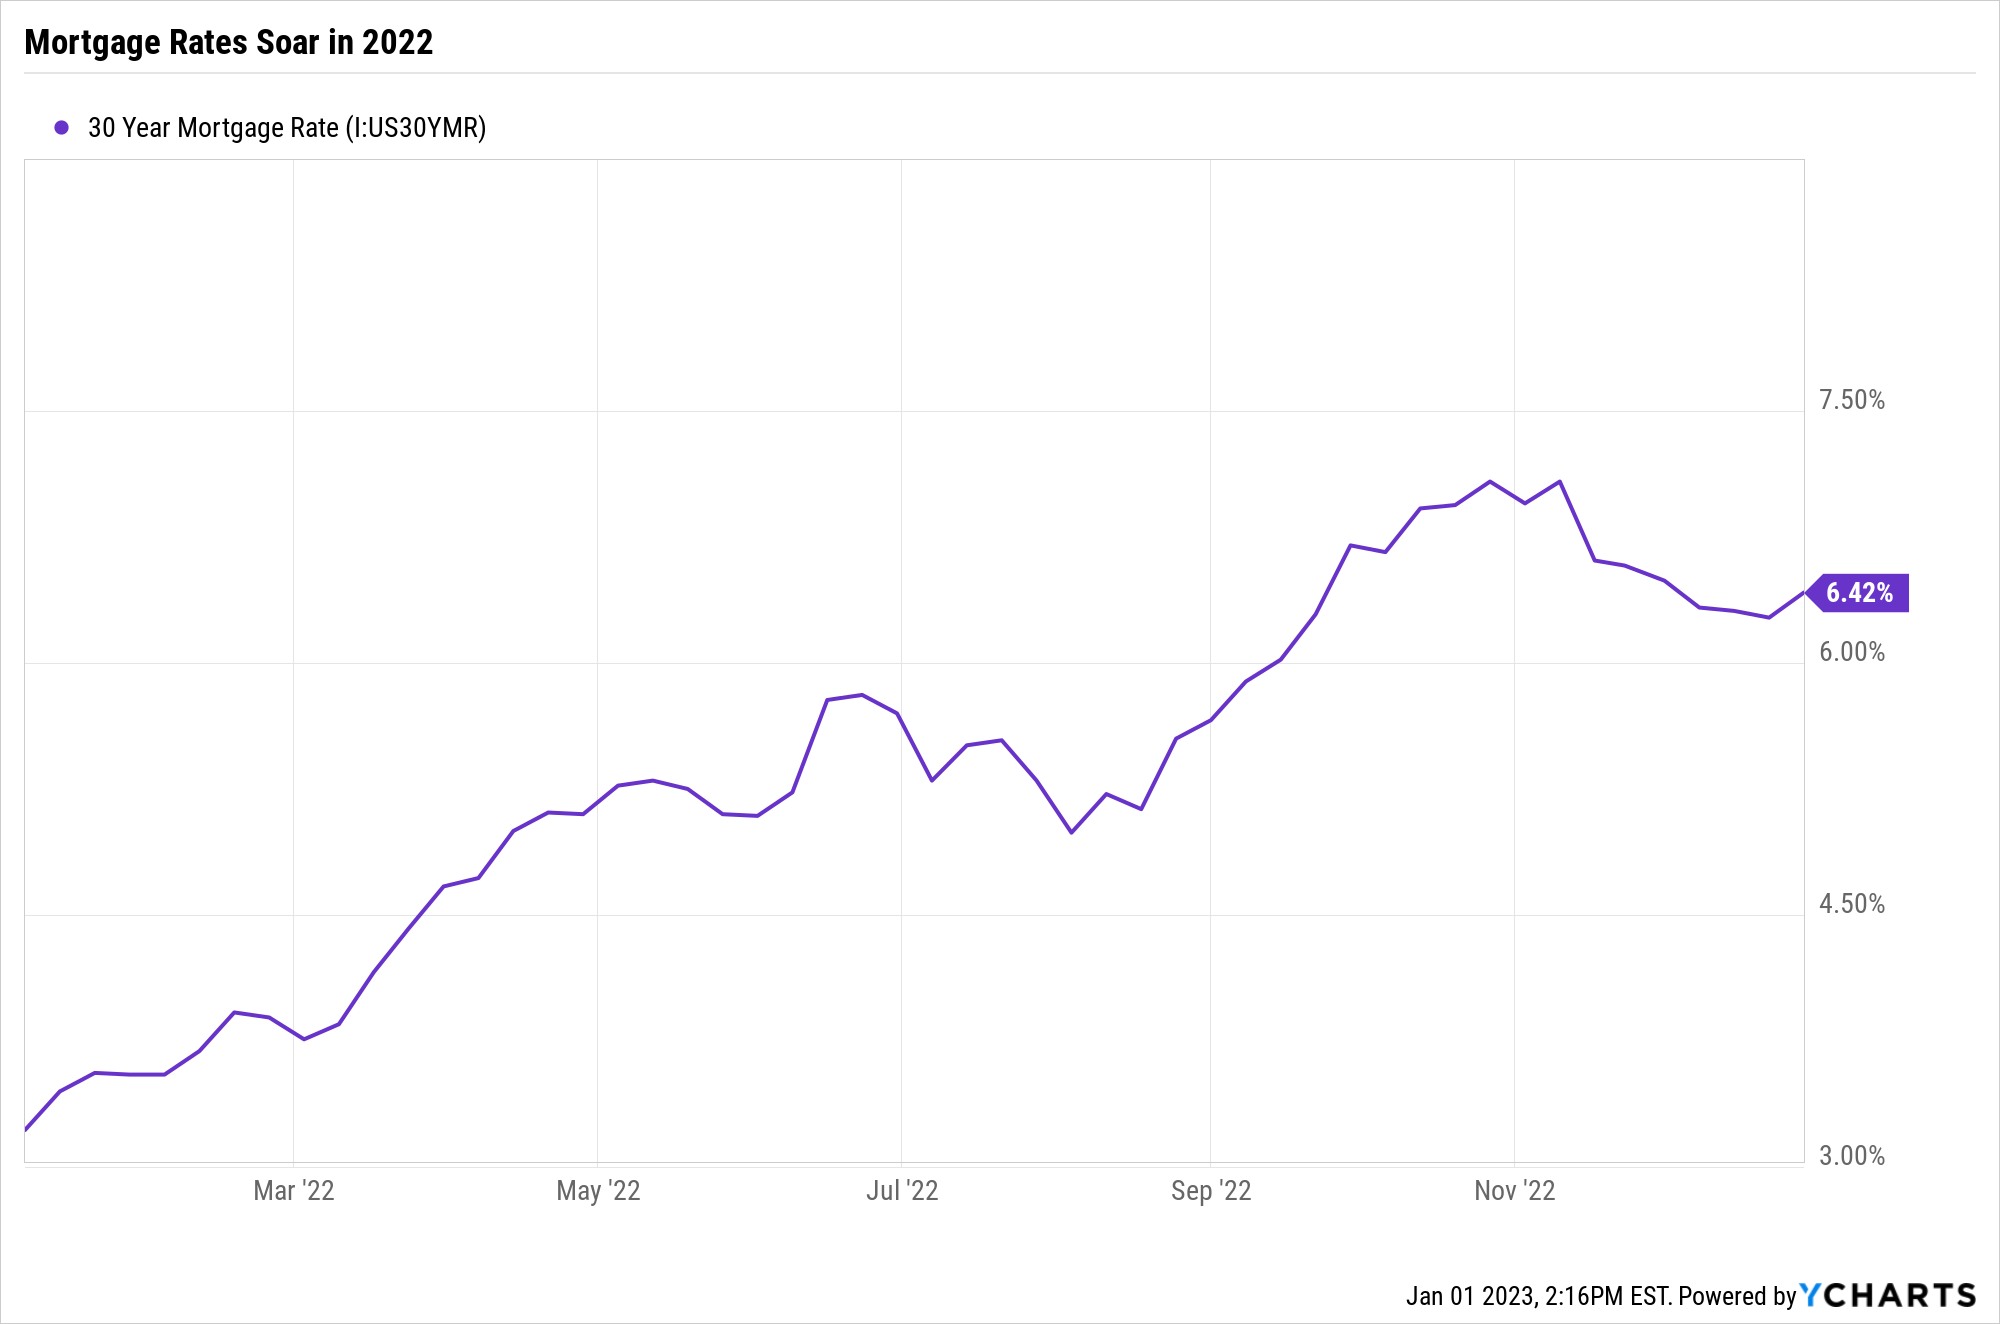
We've already seen a significant decline in housing starts since early 2022, down almost 21% since the end of April's post pandemic peak as mortgage rates doubled during the year making the typically house suddenly unaffordable for many.
Despite rising wages, the consumer is beginning to fall behind as inflation has been more than offsetting wage gains since spring 2021.
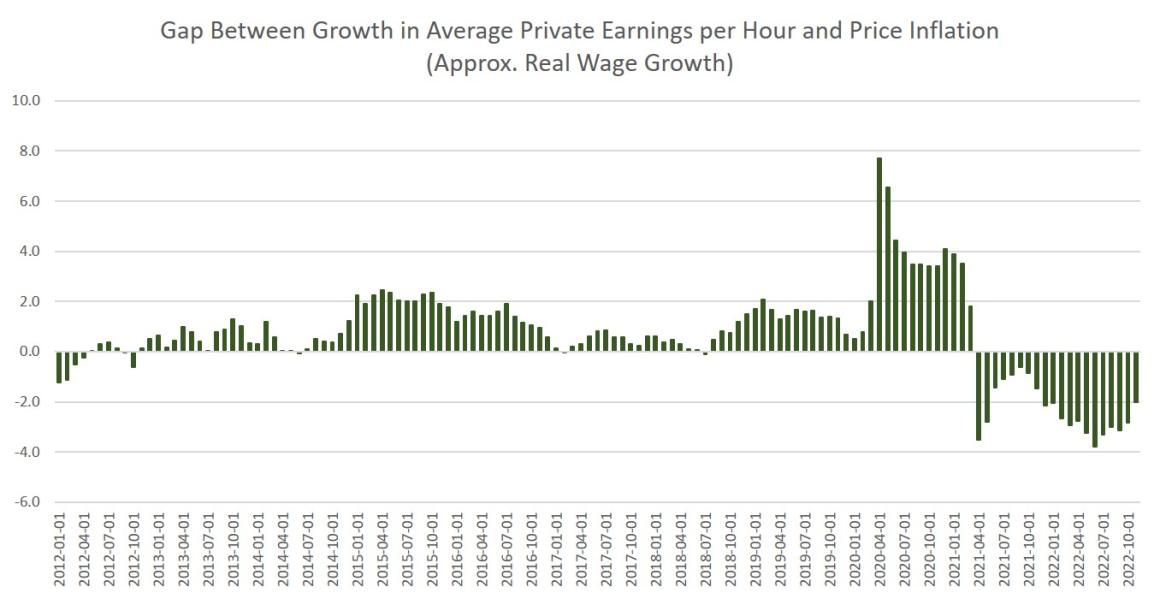
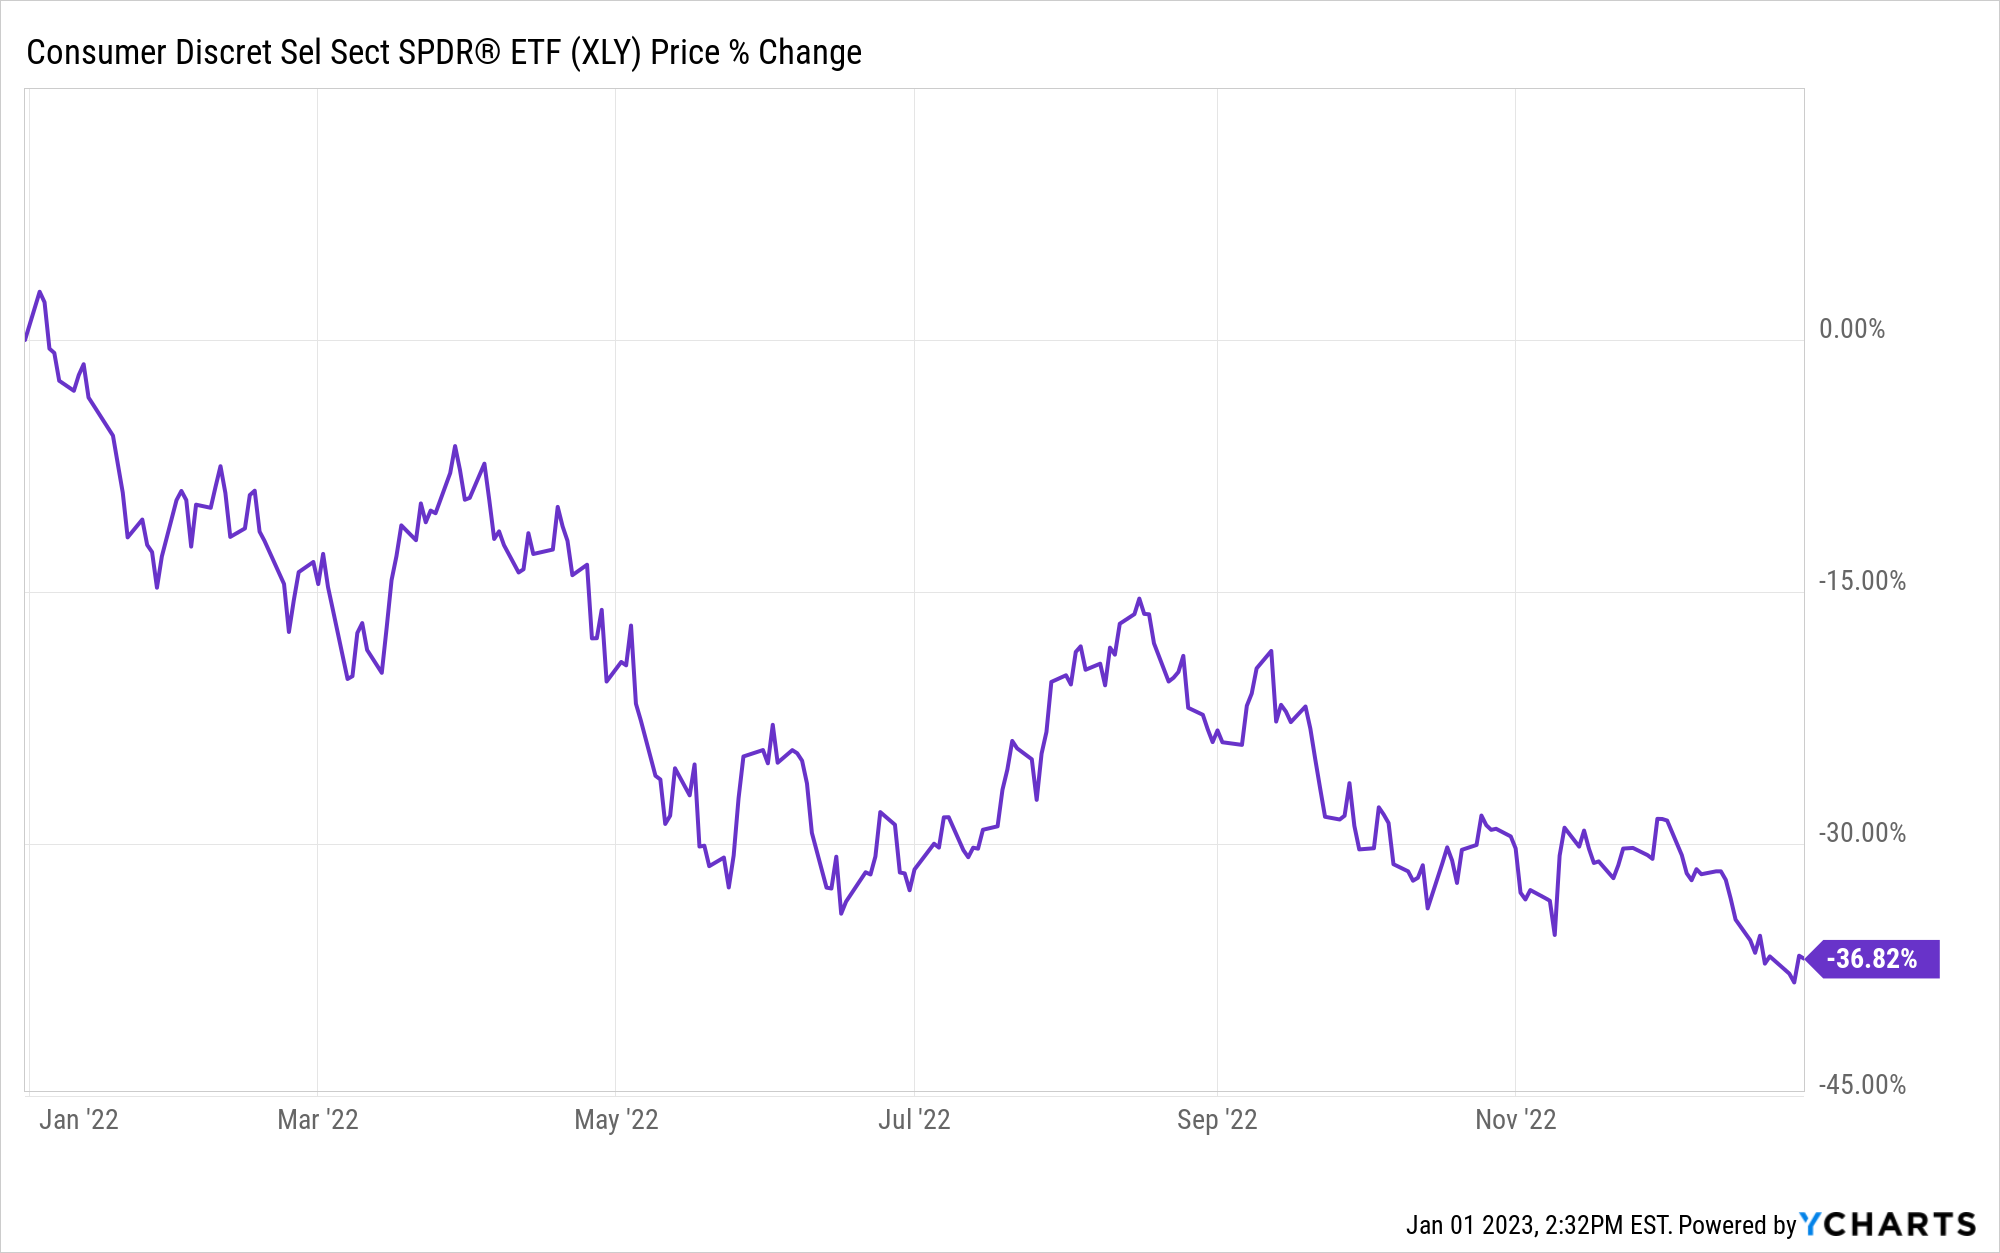
Falling real wages will result in falling demand for goods and services. Shares of consumer discretionary etf XLY (holding shares of companies like Amazon, The Home Depot, Tesla, Target, and Marriot) fell more 35% last year as investors lowered their expectations for sales and earnings growth.
Why will conditions worsen in 2023?
The costs of doing business are going up. Wages continue to rise as job openings still exceed available workers. Other costs of doing business are rising as well, squeezing profit margins to the extent prices of the goods or services provided don't rise fast enough.
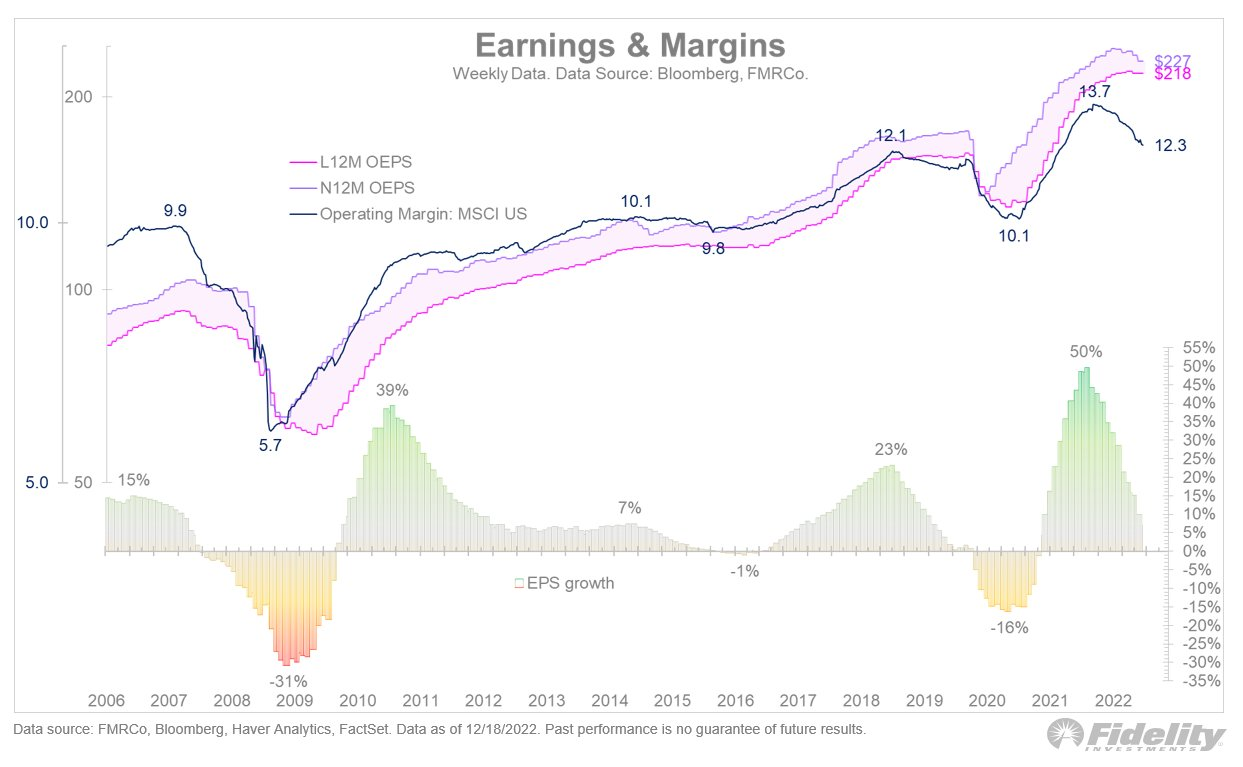
This chart from Fidelity Investments describes very clearly the problem for stocks. Profit margins are falling (dark blue line) and earnings per share growth is about to turn negative. It would be unusual for stocks to rise in this environment.
The cost of capital (the engine of growth) has risen sharply with the interest rate increases. Here is a chart of the weighted average cost of capital (WACC) for the S&P 500. It has risen about two percentage points recently and I doubt returns on that capital have gone up at all.
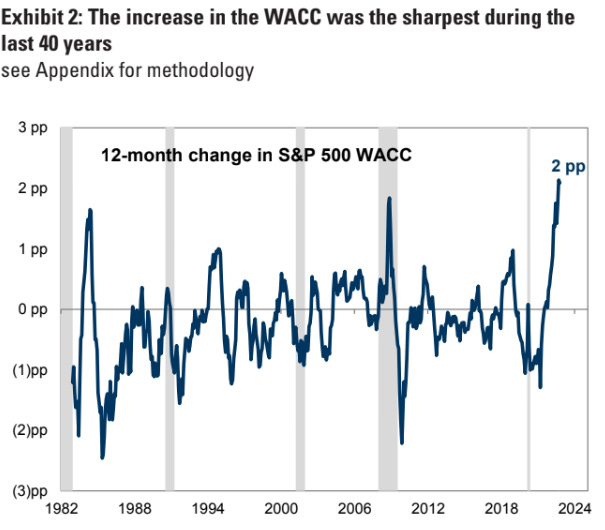
Rising cost of capital and falling returns on investment are a toxic mix for profits and wealth creation. Not only is the cost of capital rising, its availability is falling as banks tighten their lending standards for businesses and individuals alike.
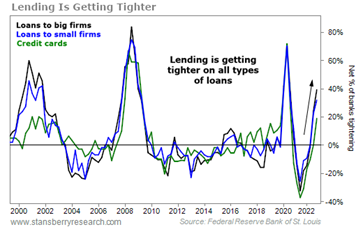
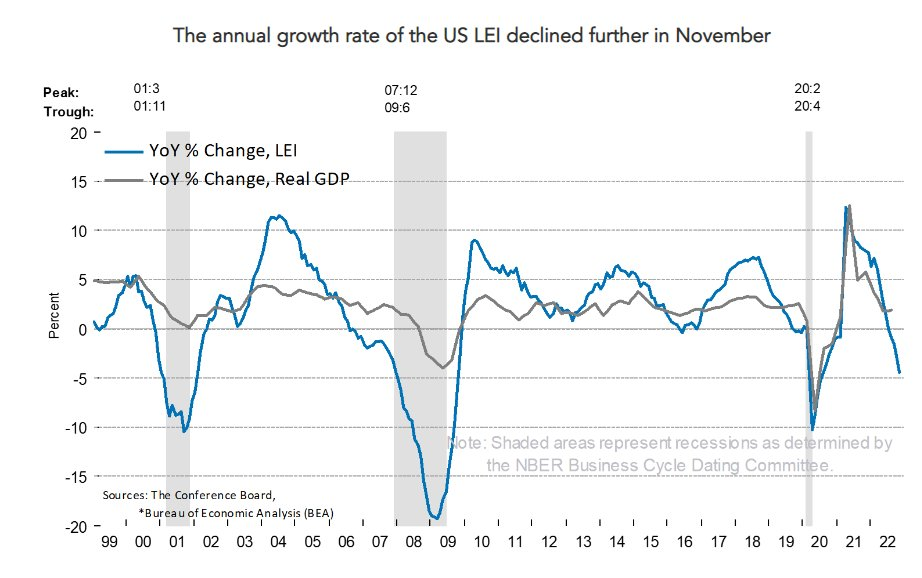
In the latter half of 2022 The Conference Board's index of leading economic indicators fell into recession territory suggesting economic turbulence ahead.
It's hard to imagine how we will avoid a recession in 2023.
Let's leave a dismal 2022 behind and focus on the future.
As you read this section remember, forecasts are usually wrong. Here, for example, is a table of stock market forecasts from late 2021 for year-end 2022 made by many of the top firms on Wall Street.
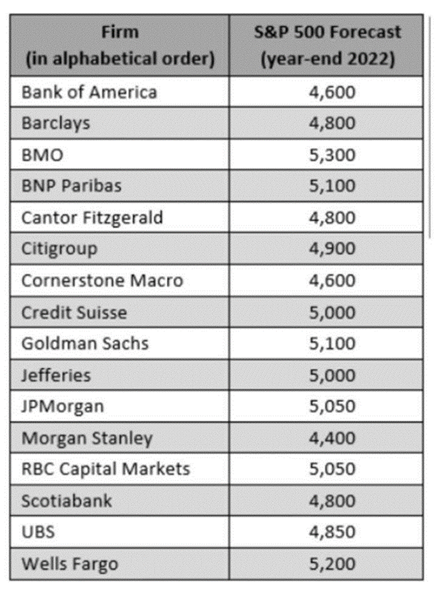
Not surprisingly, they were all wrong. The S&P 500 closed out 2022 at 3,840. Not one forecast was below 4,000 and the high, 5,300, was almost 40% higher than the actual year-end level!
Today, the spread between the highest and lowest stock market forecast for 2023 is more than 30% suggesting these strategists and market analysts haven't got a clue about what might happen this year.
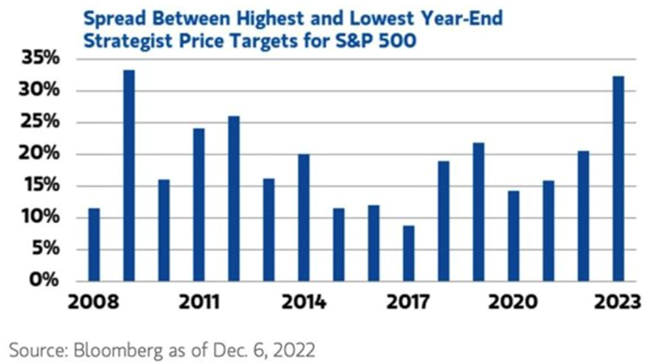
So much for forecasts!
With that caveat, here's my 2023 forecast starting with the economy:
As the LEI chart above suggests, a recession of some magnitude is very likely and it may start as early as this year's first quarter. I have no feel for how deep it will be or how long before economic growth will resume. That will depend on Fed's upcoming rate decisions, the consumer's ability to spend, corporations willingness to invest, economic growth in the rest of the world, and other factors known and unknown.
The likelihood of a financial "accident" is growing as the Fed continues to raise rates (if history is our guide). The silver lining, I suppose, is rates often reverse after one of these Fed induced accidents occurs. Nevertheless, a financial calamity could very easily extend the recession and/or bear market. (Sometimes I wonder if the Fed has caused more problems than it has solved. Or, like an arsonist in the fire department, perhaps the Fed likes to cause problems so it can come to the rescue.)
We may soon get some good news on inflation as there are growing indications that it may be peaking. A number of price series (eg. gasoline, rents, used cars, purchasing managers index of prices paid) are rolling over. Recession should also put pressure on prices. While I'm still not so sure the inflation crisis is over, any improvement will be welcome.
If you agree that a recession of some depth and duration (my guess 6-12 months) is likely this year, what about the markets? And what should we do?
Lets talk bonds first.
The silver lining of the Fed induced bond debacle is higher yields. This is great news for savers and investors. Below is a chart of current yields for various types of fixed income investments.
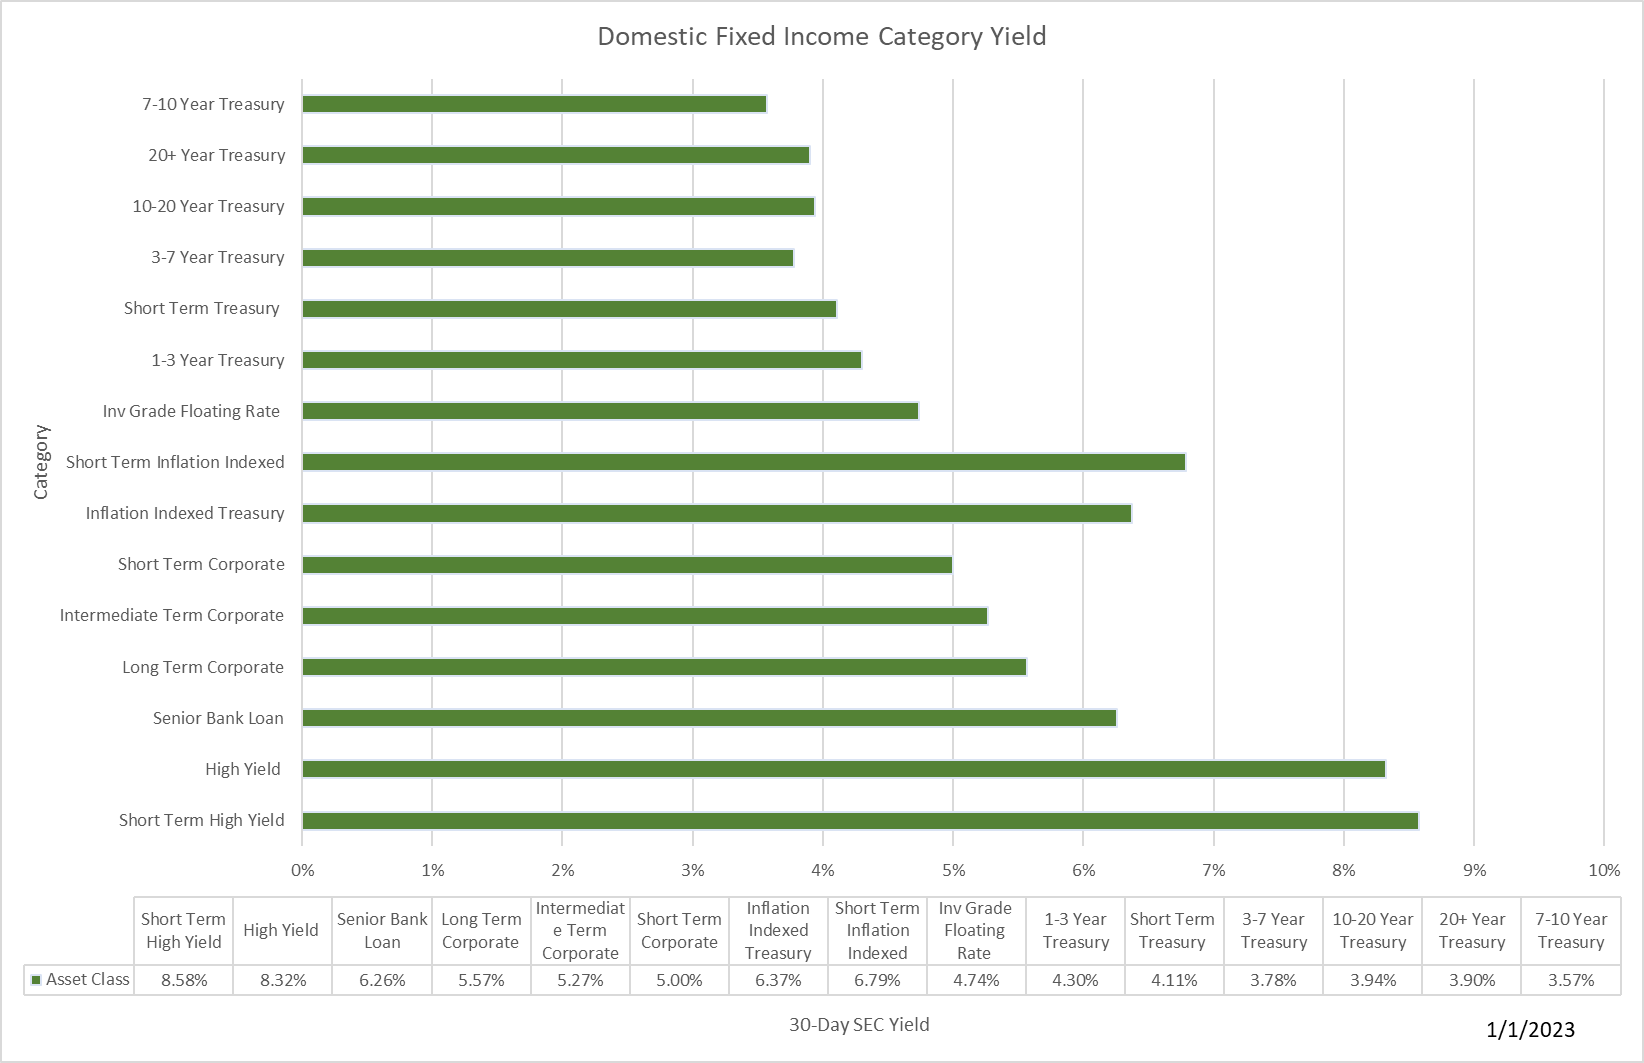
Yields are now 4% or better in most categories. In the short run, yields will probably head higher as the Fed has clearly communicated its plans to continue hiking rates albeit at a slower rate of increase. Once the Fed does pause or reverse direction, bonds should react quite positively. I suspect bonds will do better than most stocks for awhile given the fundamental factors facing stocks. Shorter term bonds should do better if the yield curve returns to its normal positive slope. High yield corporate bonds (junk bonds) may disappoint as concerns over recession induced defaults grow. On balance, I think bonds as an investment look a lot better today than at the start of last year.
Will stocks follow bonds higher in 2023?
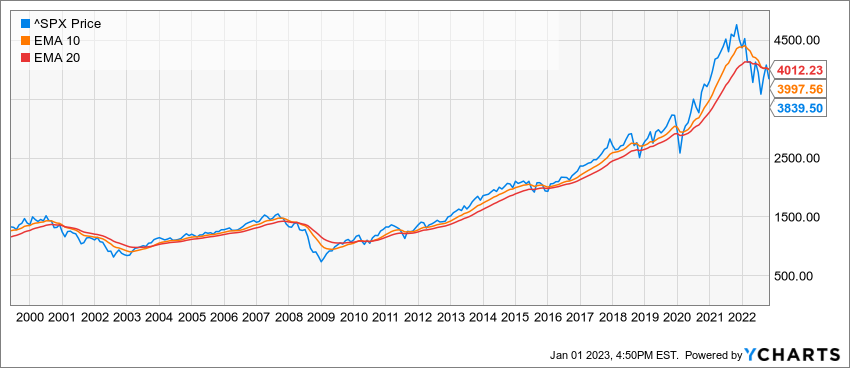
Today, I believe we are still in a bear market. Here's why.
First, momentum remains bearish. The S&P 500 closed out 2022 at 3,840, below both the 10-month and 20-month exponential moving averages. Importantly, the shorter term moving average is now below the longer term moving average, a pattern seen in early 2001 and early 2008. In both those cases, we experienced deep, extended bear markets.
This weekly chart of the S&P 500 using the 50 and 100 week simple moving averages exhibits the same bearish pattern.
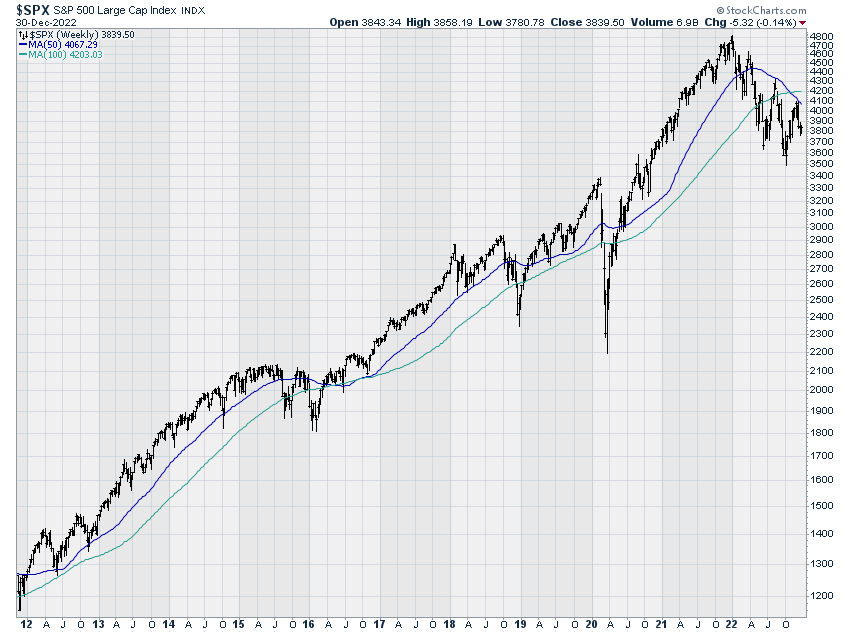
So it would be surprising to see the market reverse and begin a sustained advance at this juncture given current trends of inflation, interest rates, and the economy. Particularly when you look at prior bear markets since WW2.
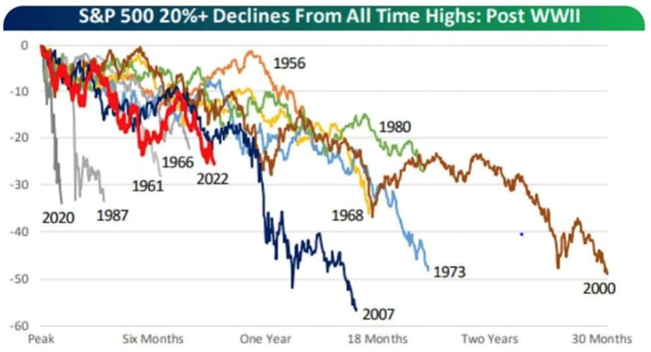
The current bear market (red line) seems to be following a fairly typical pattern which suggests that stocks may still head lower for at least another six months or more. Here's why:
I am increasingly of the opinion that valuations (P/E for example) may stop receding if we get some moderation of inflation and the Fed slows or pauses its rate hikes. I doubt the market's P/E will fall back to 10x like it did in 2009 and 2012. My single point estimate is 15x, a bit lower than today and below its long term average. Again, I'm assuming some good news on the inflation/interest rate front. All bets are off if that good news is not forthcoming!
As the market's P/E starts to stabilize, concern shifts to fundamentals. Simply put, it seems unlikely that corporate earnings will advance in 2023 given all the factors we have already discussed. Yet analysts have yet to meaningfully adjust their forecasts for 2023 earnings.
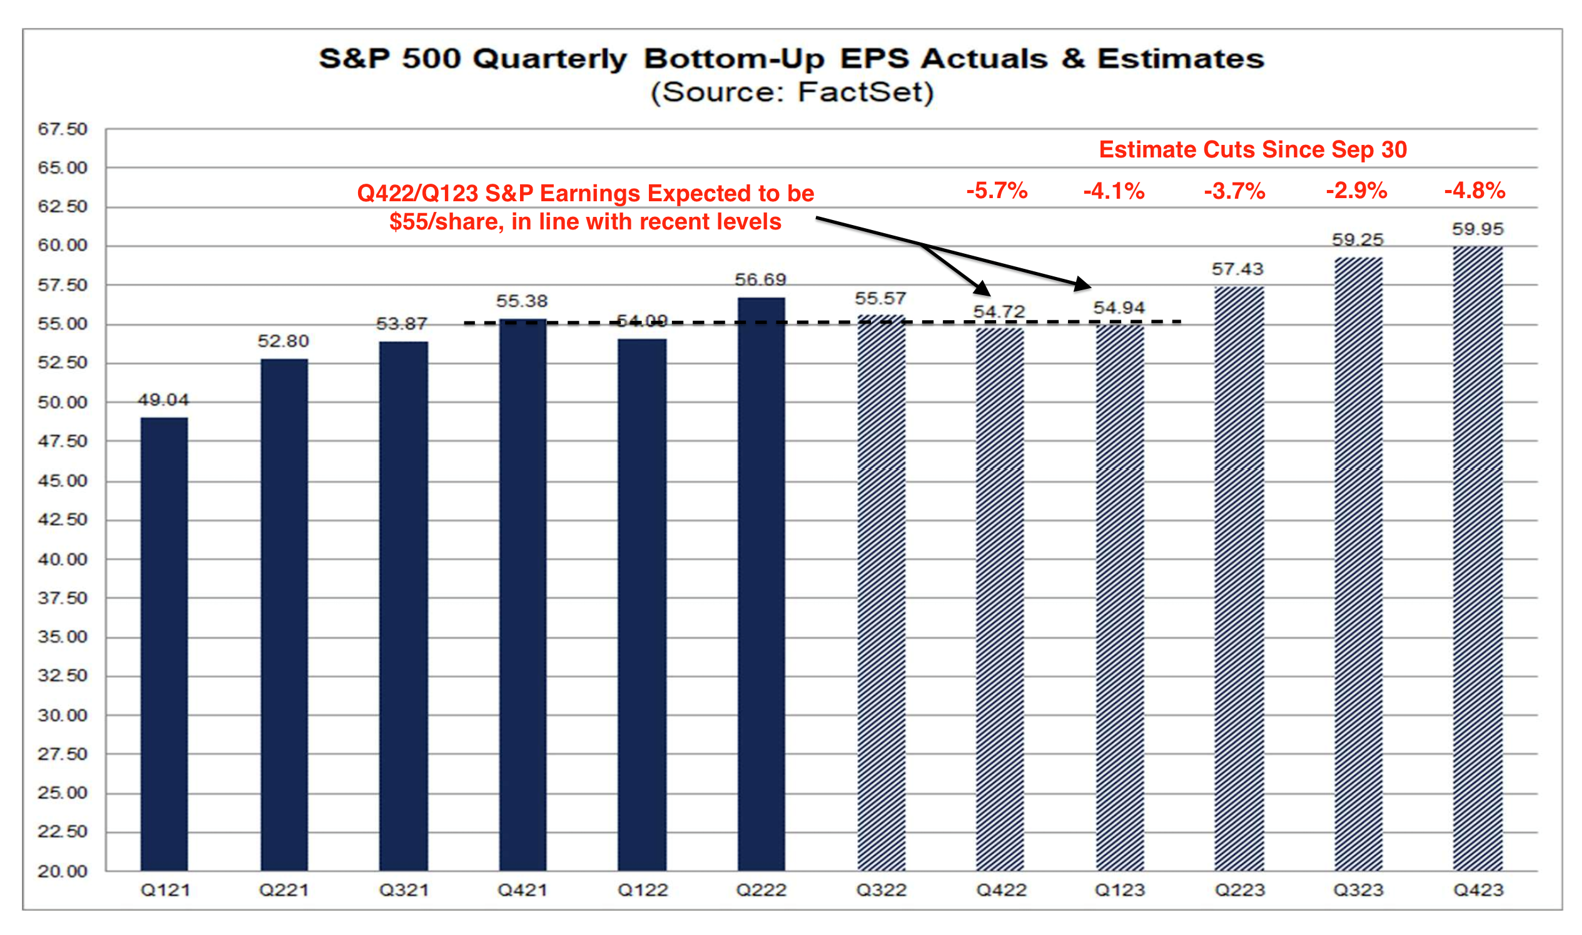
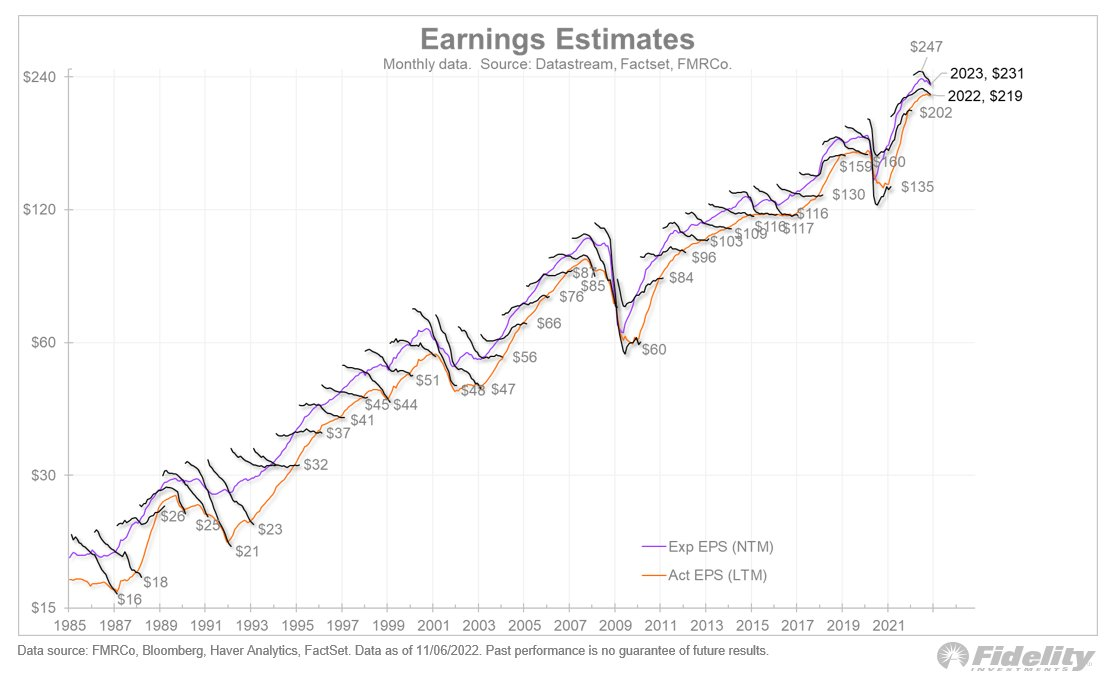
This chart from Factset shows only slight downward adjustments that add up to expected earnings for the S&P 500 of 231.57. This chart from Fidelity Investments is an important reminder that most years analyst estimates start out high and fall throughout the year. I'm betting this year is no different.
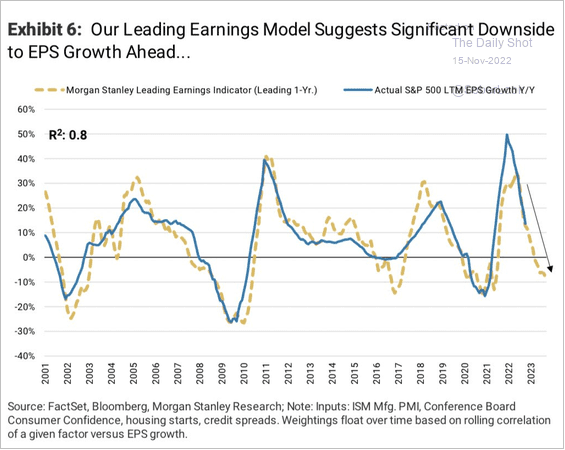
Indeed, Morgan Stanley's Leading Earnings Model indicates a decline of perhaps 10% in 2023.
If 2022 earnings settle in at around 220, then earnings in 2023 should be around 200 not 231 as the Factset chart above indicates. Simple math then gets us to a forecasted 2023 downside target of 3,000 (earnings of 200 X 15P/E) or a further decline of 22% from current levels. Ouch!
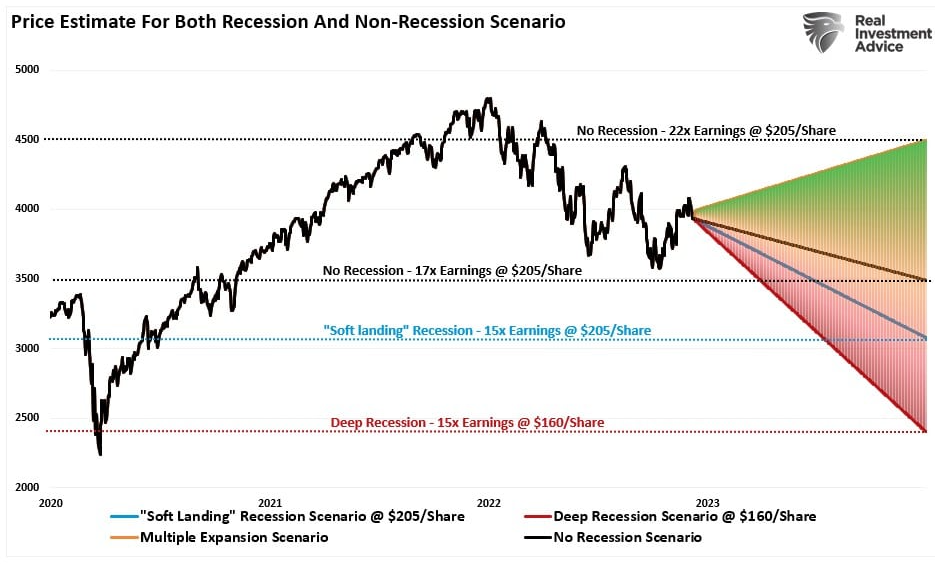
Don't like my forecast? Here is a forecast from Real Investment Advice that has four different scenarios. Their "soft landing" scenario is similar to my forecast.
The important thing to remember is these are forecasts. There are many moving parts. Actual returns are unlikely to match my forecast or anyone else's except for pure luck. Hopefully, I'm too pessimistic.
A cautionary note: There may very well be a nice rally in January after the significant tax loss selling which occurred in December. It could also be fueled by disappointing employment numbers in January raising hopes for a Fed pause. I would not chase stocks in this rally but if the Fed does pause, adding to bonds could make sense. If I'm correct about estimates being too high, investors are likely to be disappointed by earnings reports in mid-January and again in April, keeping downward pressure on stock prices.
Bear markets typically end in the middle of the recession after the Fed stops hiking interest rates. When the expected recession ends is anyone's guess. So here's my guess: By late summer/early fall we should be reaching the nadir of the economy. At that point, I believe stocks will start to look very interesting again.
In the meantime, patience is required.
Retirement Investing Update
Late last year, SECURE Act 2.0, was signed into law. The act makes several favorable rules changes that you should incorporate into your retirement planning. Here are some of the highlights.
- The age the required minimum distribution (RMD) starts is now 73 and will increase to 75 in 2033.
- Penalties for failing to take an RMD fall significantly.
- Qualified Longevity Annuity Contracts (QLAC) maximum value has increased from $135,000 to $200,000 and there is no longer the 25% maximum percent of IRA value limit.
- If you are still in the saving-for-retirement mode and over 50, you will be able to make additional "catch-up" contributions to your retirement accounts.
Fidelity Investments has a good summary of all the pertinent changes. You can find it here. As always, I suggest you speak with your financial advisor and/or accountant before you take any action.
Finally, with the recent changes, now is a great time to review your retirement plans. If you are a DIYer, check out NewRetirement.com. They offer a very comprehensive planning tool to help you make sure you're on the right track. There are both free and paid plans available.
Under A Buttonwood Tree Updates
It's been awhile since our last newsletter! Hopefully you have been keeping up with our weekly Chart Attacks! After time off for the holidays, Chart Attack! will resume its weekly schedule next week. Chart Attack! is usually emailed over the weekend but sometimes spills into Monday morning. (The publication schedule for Under A Buttonwood Tree remains "as the spirit moves me".)
If you visit the website you might notice that some changes are occurring. Please excuse the mess while I make improvements. Like the Fed, I need to break things before I can fix them!
And Finally!
Welcome new readers. Thank you!
Please feel free to forward this newsletter to a friend.
If you're not a subscriber and would like to be, just click the subscribe button. Your subscription includes this newsletter, the weekly Chart Attack!, and access to the restricted areas of our website. Best of all, it's free!
I'm always interested in your feedback, ideas for topics, and questions. So please click the button below.
If for some reason the button doesn't work, please email us at: under.a.buttonwood.tree@gmail.com