
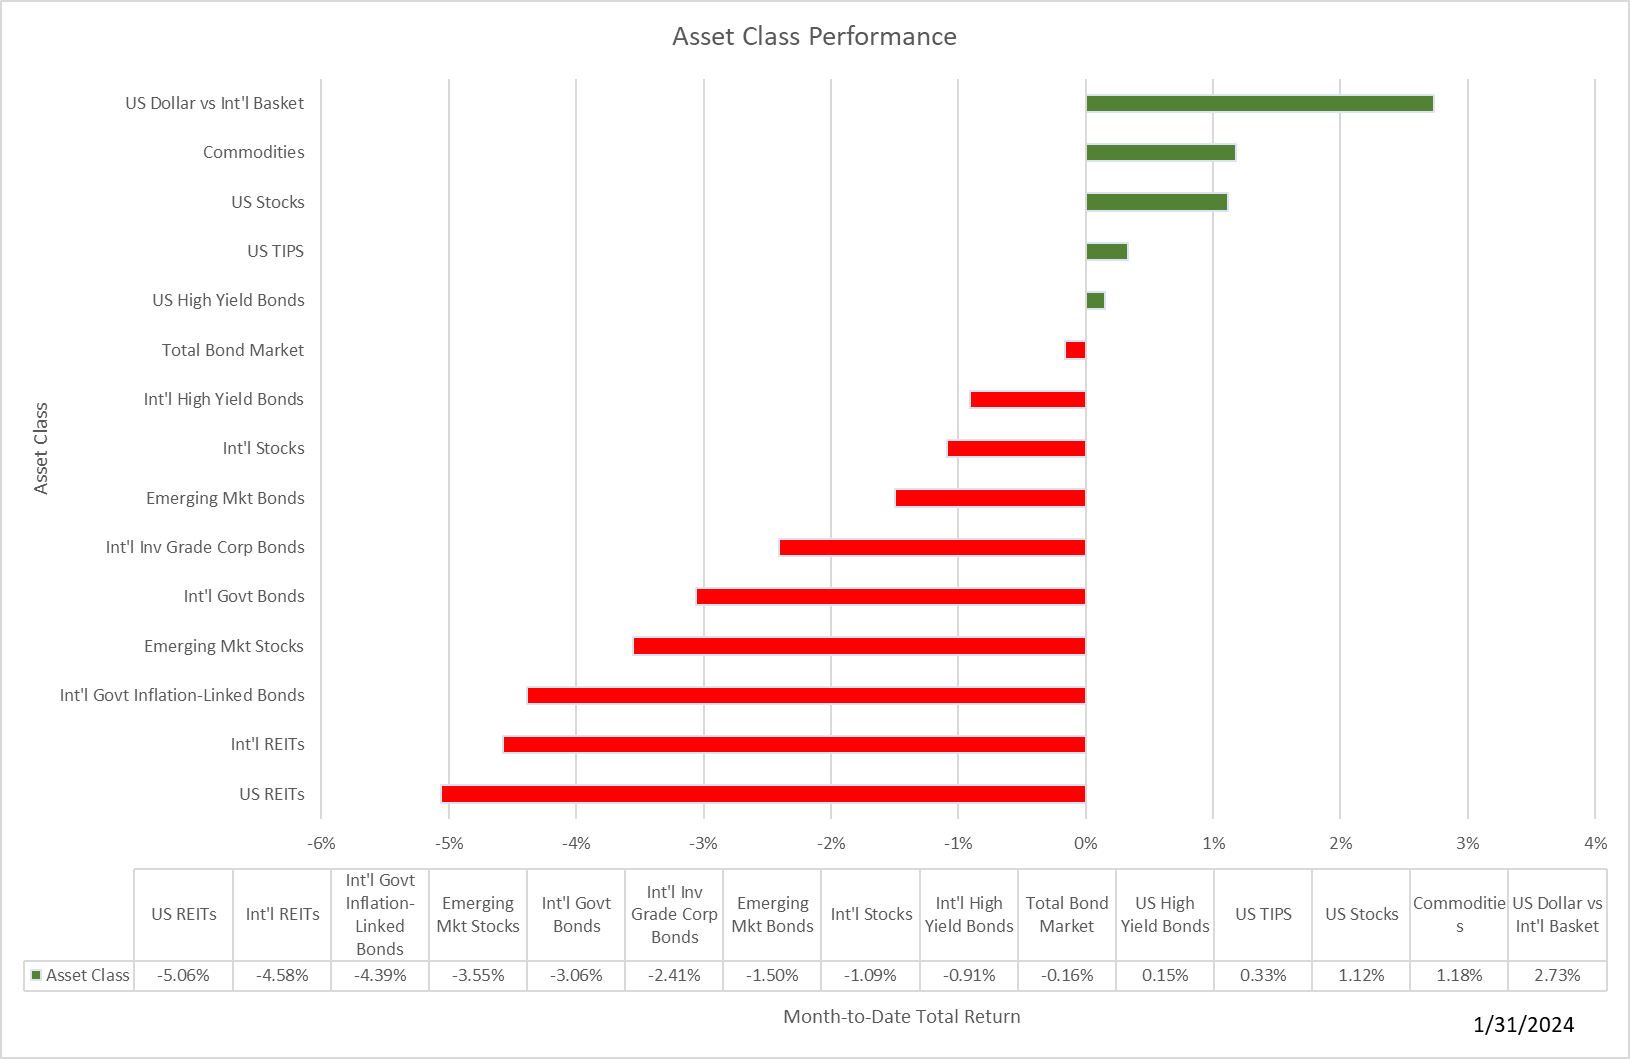
With January "in the can", it's time to assess what happened last month and what it may mean for the rest of the year. We'll start with our usual charts based on month-end results.
The dollar, commodities, and domestic stocks all posted gains in January. Everything else got whacked as questions arose about the timing of a Fed rate cut.
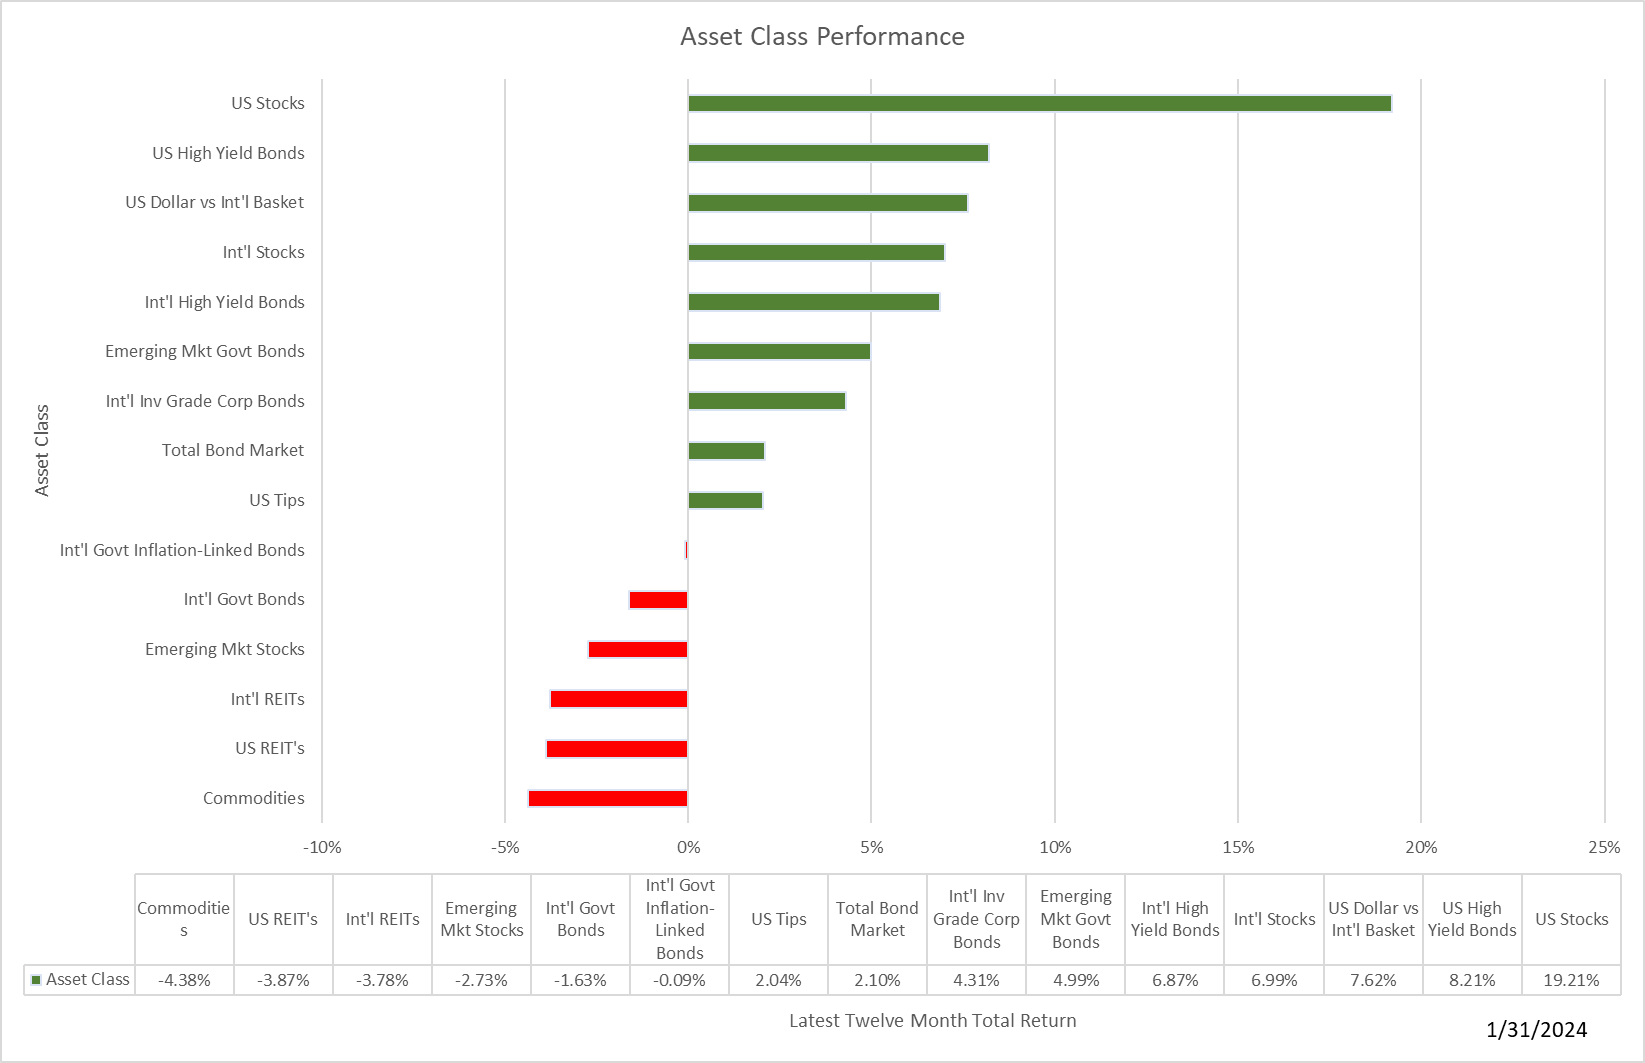
The picture is much brighter for the twelve months ending January 31, 2024!
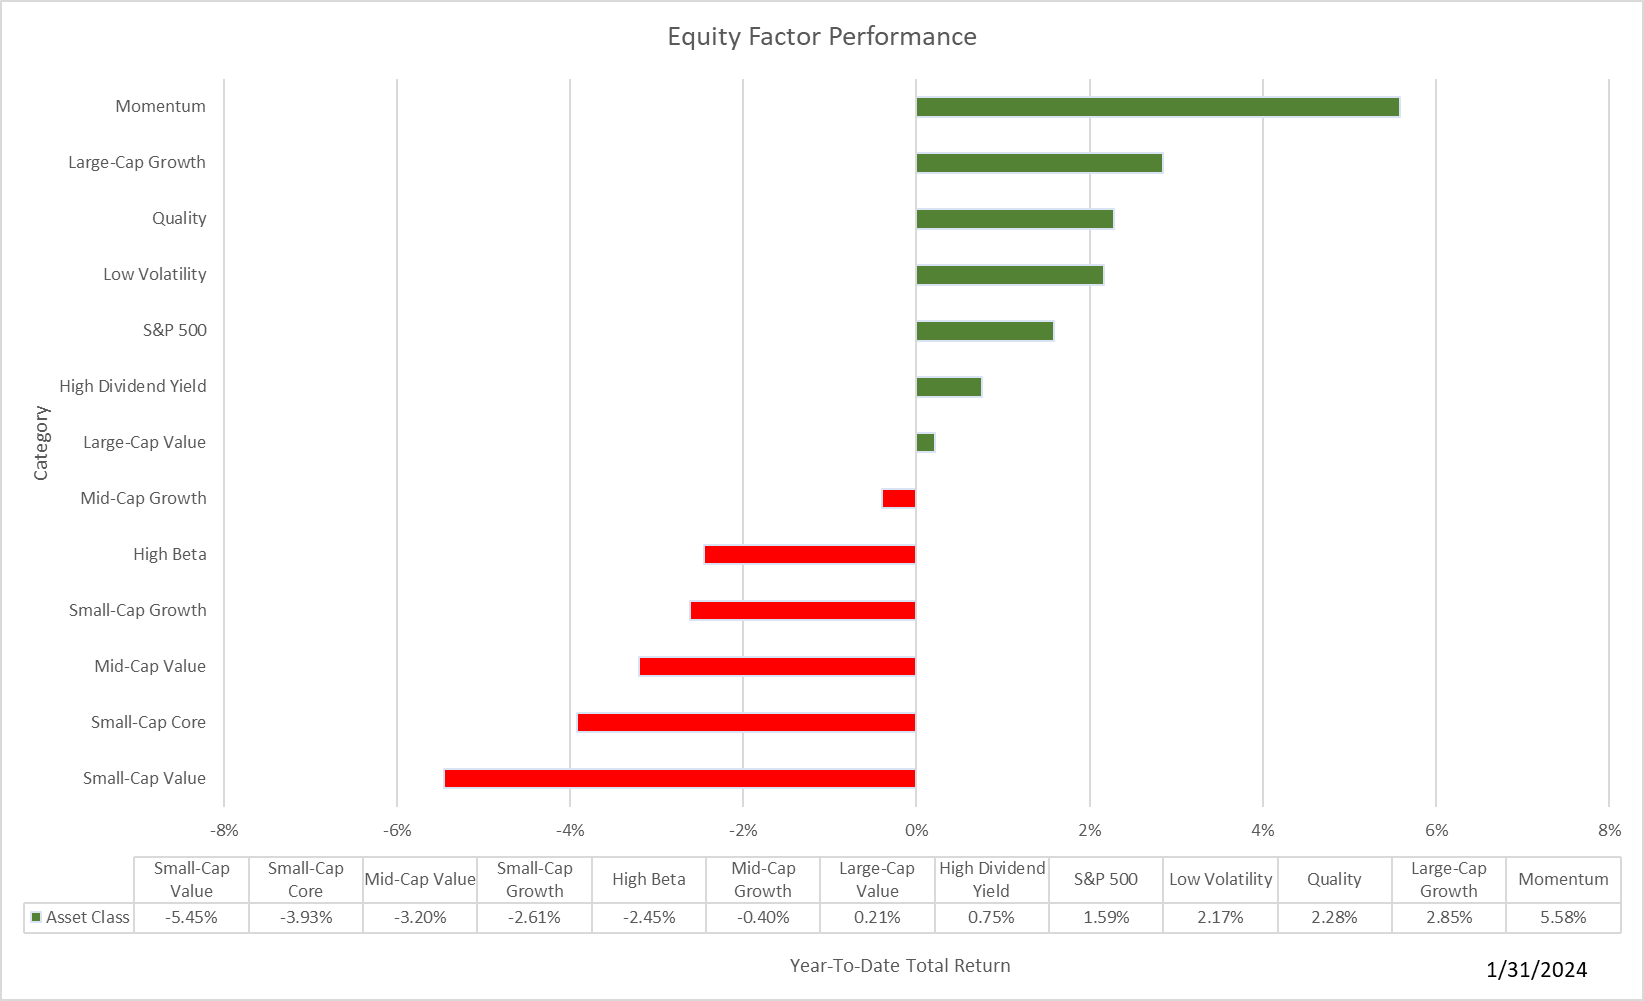
Momentum was the dominant factor for performance last month.
Download the latest market update report here:
And asset category returns here:
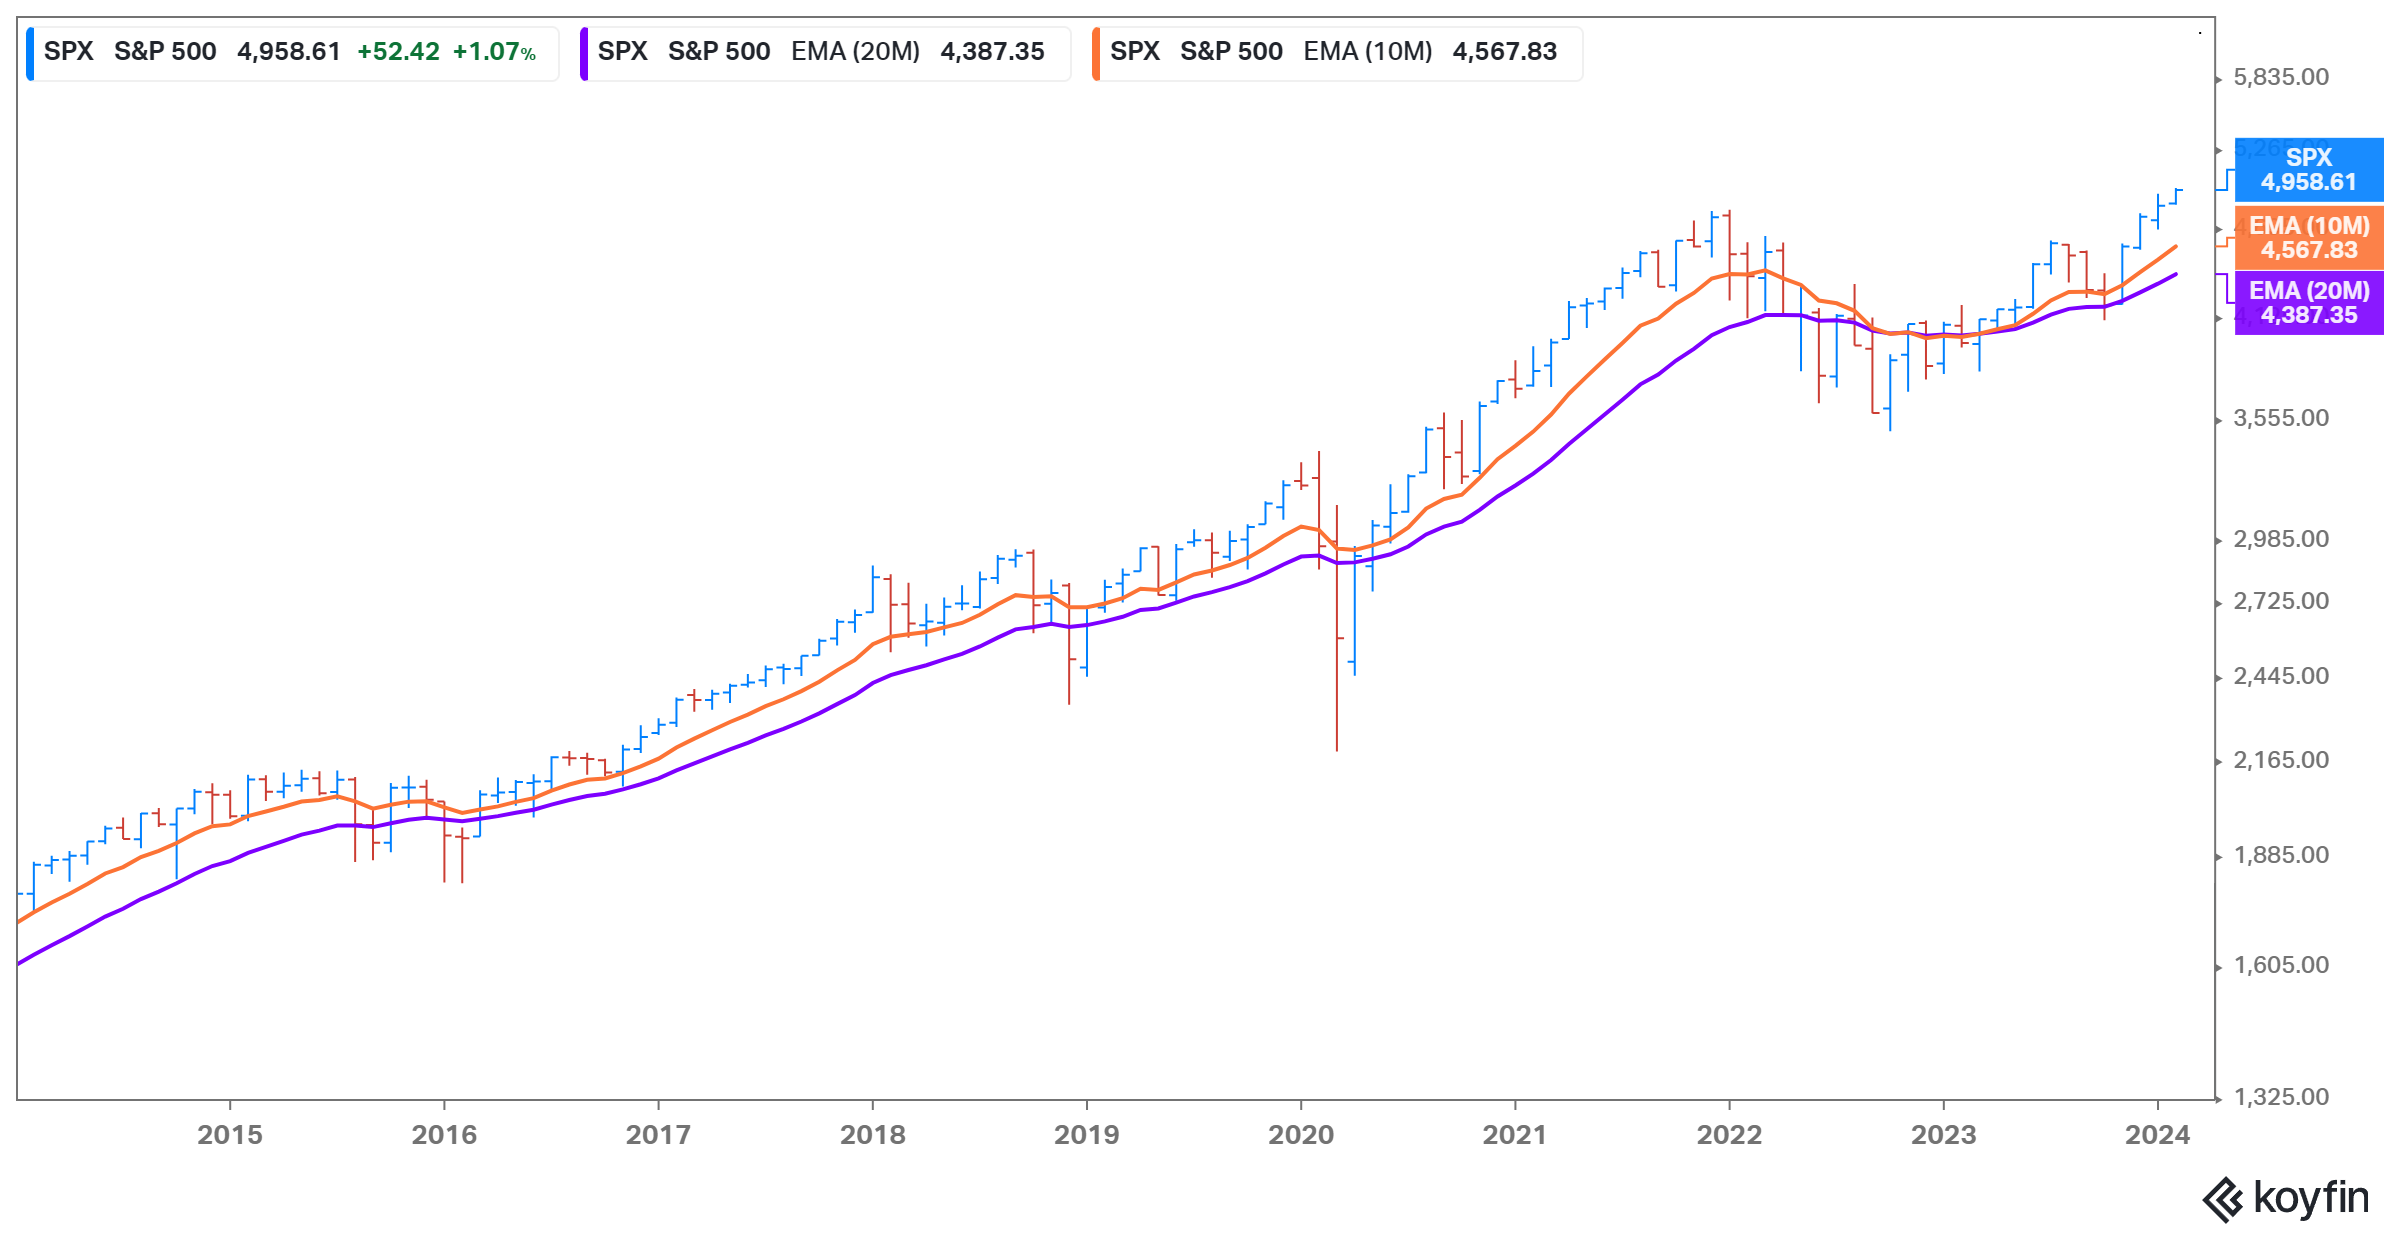
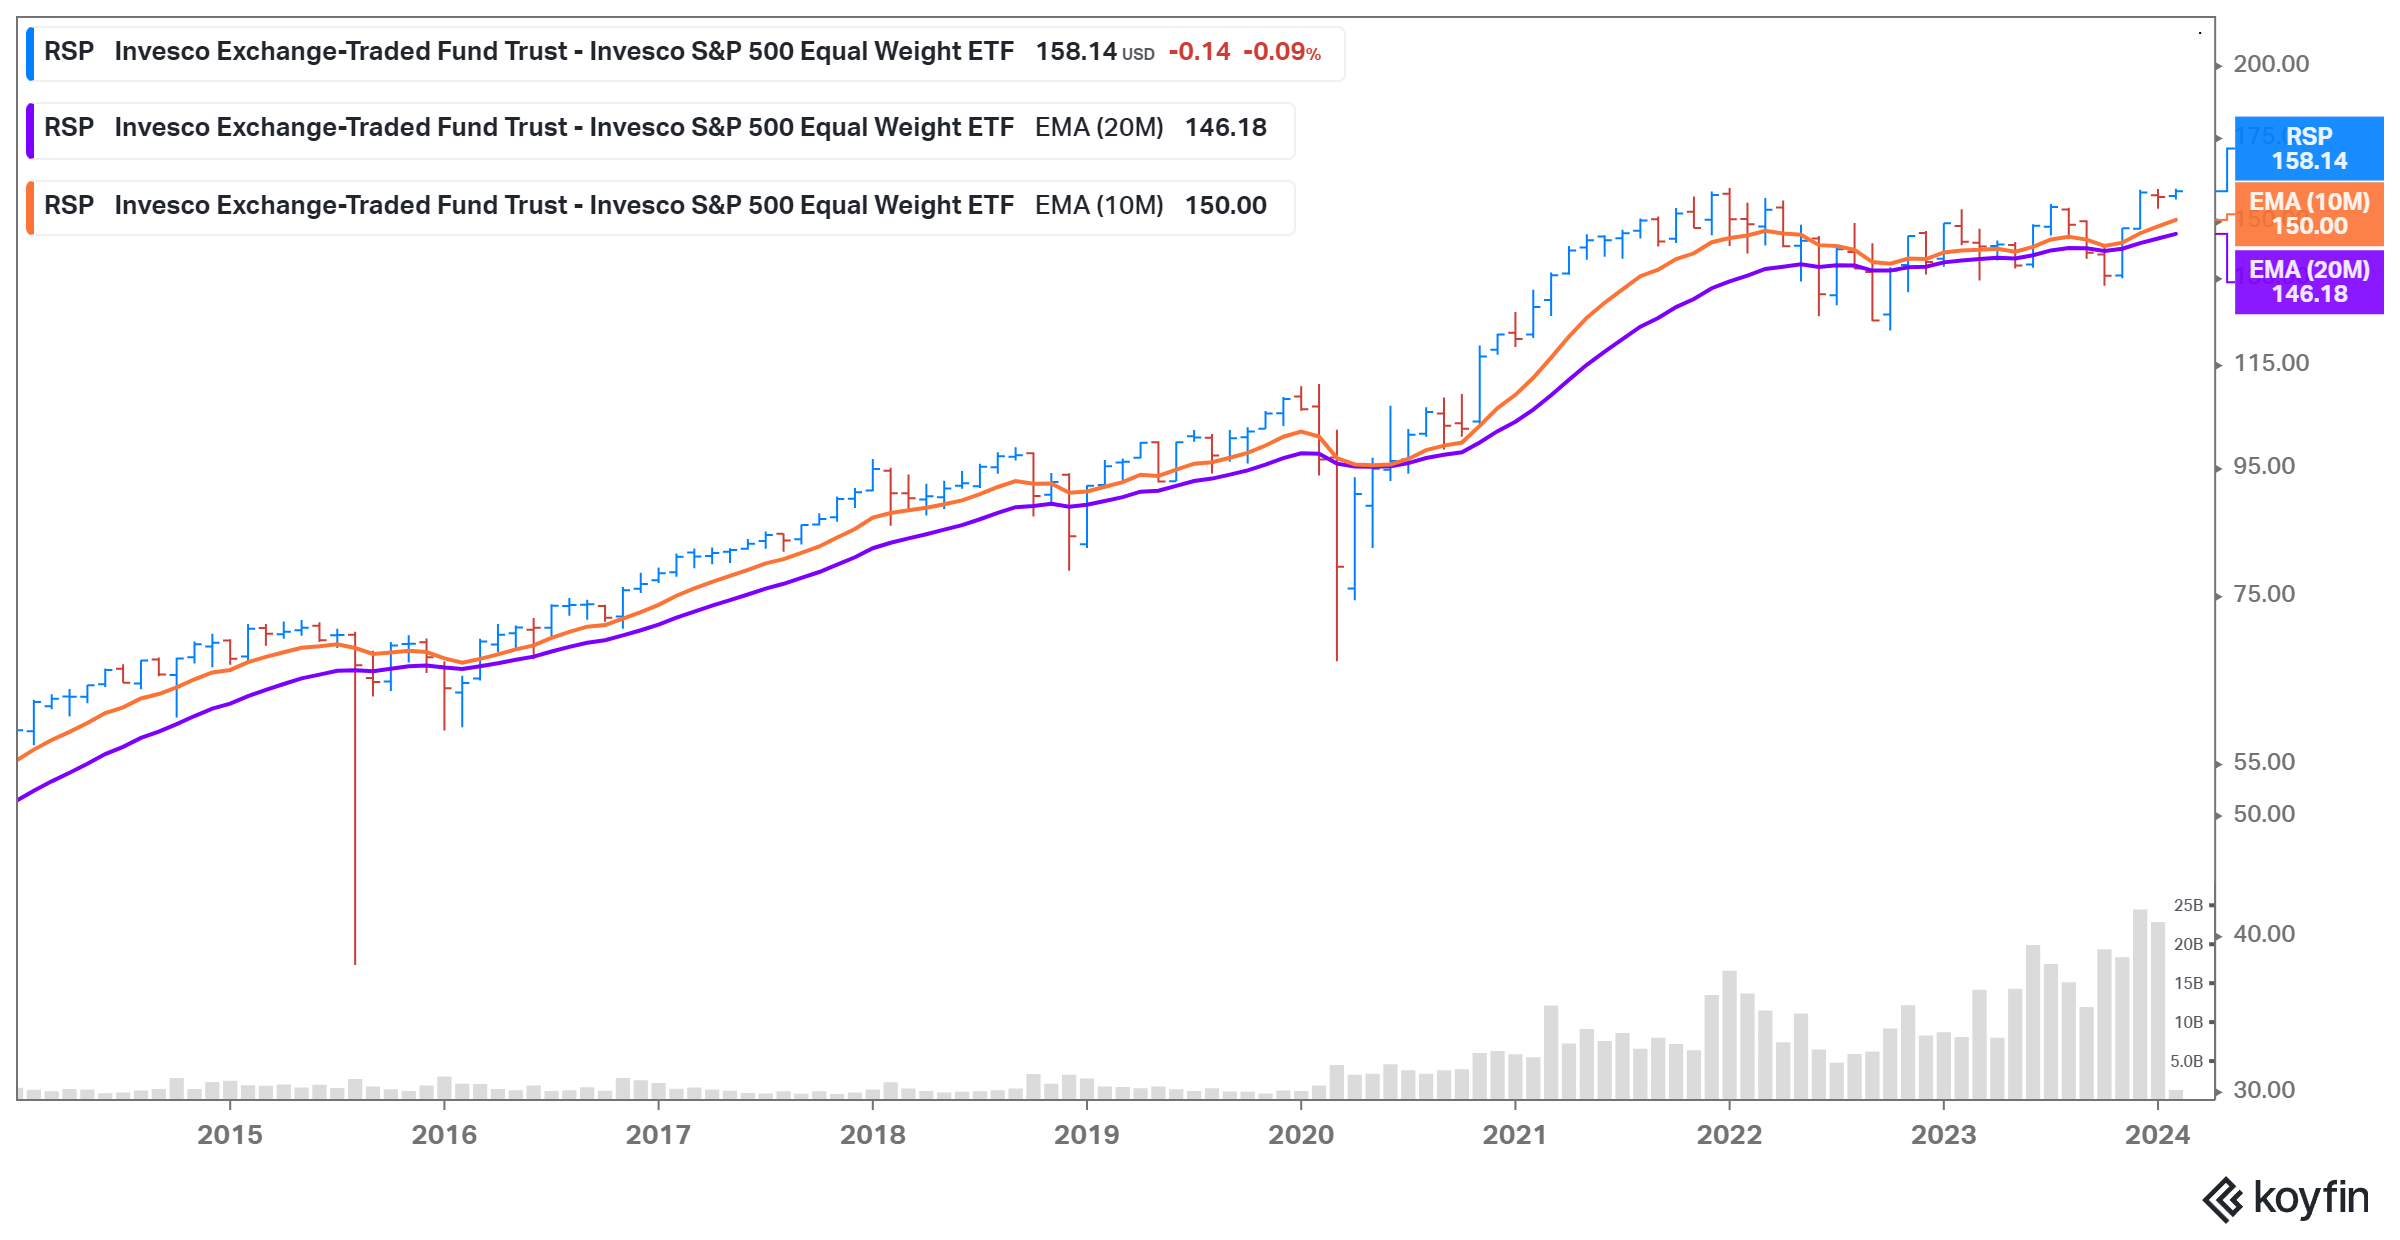
Our favorite monthly moving average chart shows the S&P 500 comfortably above both moving averages indicating we're still in a bull market.
The equal-weighted S&P 500, although not quite as dynamic, is also in an uptrend.
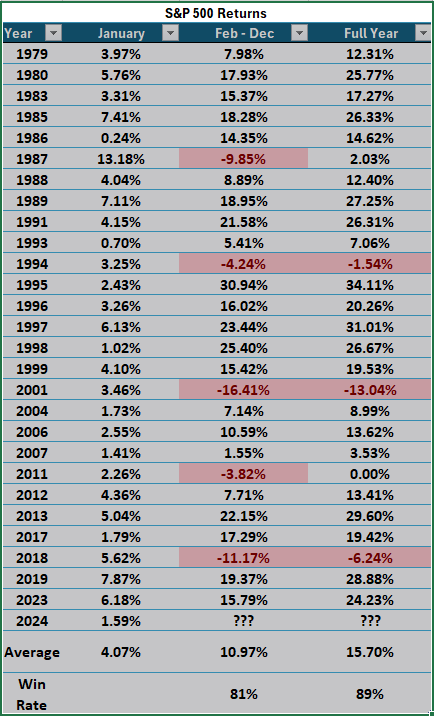
Are you familiar with the "January Barometer"? Simply put, this indicator posits that January's performance indicates the market's direction for the balance of the year. This table lists all the positive months of January over the past four decades along with the returns for the rest of the year. Almost 90% of the time the market has posted a positive return for the year. Pretty good odds...
Here's Fidelity's take on the January barometer: