In a prior newsletter, I referenced a blog post which implied, correctly in my view, that market timing is a waste. Jumping in and out of cash will likely result in subpar returns. However, while I'm not a fan of this type market timing, I do think it is helpful to gauge the market's "health" based not on predictions of the future but by what is going on right now. Why? By knowing the current market situation, a bull or bear market for example, and whether or not it is changing, you are able to make some reasonable judgements about the amount of risk you are willing to take on in your portfolio.
I use several indicators to help me better understand the market's trend. In this newsletter I'll discuss one of the three moving averages that help me discern the market's direction. (I am going to direct you to Investopedia for the definition of a moving average.)
When you look at the movement of individual stocks or indices over relatively short periods of time, days or weeks, there will be a lot of noise, short term fluctuations, making it difficult to determine the long term trend for the stock market. So I employ a 20 month exponential moving average to smooth out the noise. Here is a chart using an 80 week exponential moving average (similar to the 20 month) of SPY, an ETF that tracks the S&P 500.
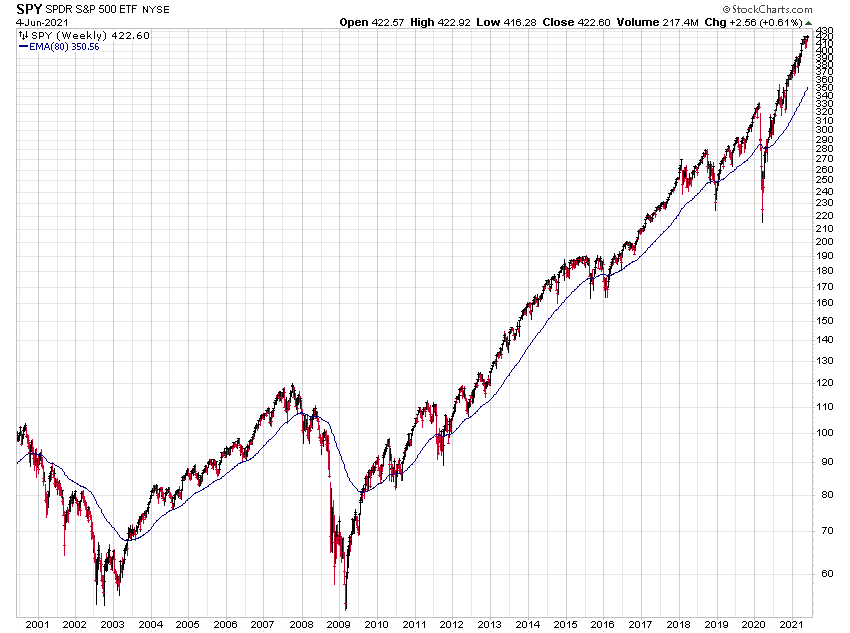
The solid line indicates to me the long term direction of the market. If it is rising, it's a bull market. Falling, it's a bear market. The simple rule is this: If SPY is below the line, maintain a cautious stance towards stocks. If SPY is above the moving average line, increased exposure to stocks is warranted. (All this should be considered in context of your overall financial situation and risk profile.)
You can see that we've been in a bull market since 2009. The dips below the line in 2011, 2016, 2018 and 2020 did not cause the line to change direction (maybe flatten out a bit), they were simply "corrections" (except 2020 - that was a hell of a correction!) in the long term trend.
However, when you look at 2001 and 2008 you see the SPY trading below the moving average which is declining - a bear market. Again, this would be the time to be cautious - avoiding leverage, highly valued stocks, etc.
In future newsletters, we will discuss potential ways to take advantage of the long term trend of the market.