Our last post on market timing discussed briefly it's efficacy and one of several indicators I use to discern the stock market's underlying trend - the 20 month exponential moving average. You can read that discussion here.
Now I am going to describe the other two moving averages, the 50 and 200 day simple moving average, and how I use them.
Here is the chart of SPY which tracks the S&P 500. The blue line is the 50 day and the red line the 200 day moving average. Once again the trading rule is simple in concept - own stocks when SPY is trading above the moving average, don't own them when the SPY is below the moving average.
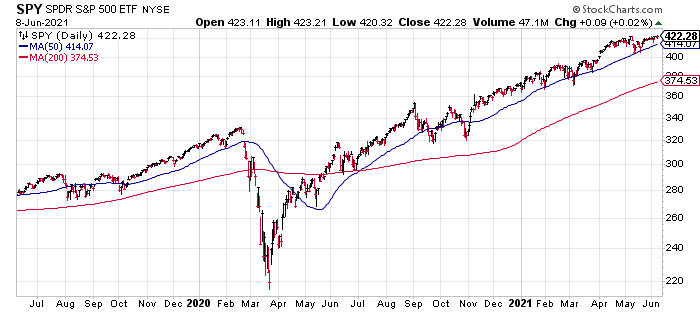
But there is a problem, particularly with the 50 day moving average. Notice how frequently SPY darts above and below the line. If you followed the trading rule, there'd be a lot of buys and sells but I'm not so sure you would improve your return versus simply buying and holding. I suppose you could try to ignore the "wiggles" around the line like we saw in 2019. But how do you know if the next close below the 50 day moving average is the start of a real correction or even a bear market? You can't, except in hindsight.
The 200 day moving average is a bit better. Because it is a longer time horizon, there are fewer trading signals. In the case above just two, a sale in early March 2020 and a buy in late May 2020. However, looking at the chart it appears making those trades didn't add any value and if these trades were taking place in a taxable account they hurt your after-tax total return.
So why even bother with moving averages? Again, I'm interested in the overall trend in stocks. When these moving averages are rising we're in a bull market, when they are falling, a bear market. When I know the trend, I can adjust the risk profile of my portfolio to reflect that environment.
Here's another way to consider the moving averages we've discussed. Think about them as a traffic signal. When SPY falls below the 50 day moving average, it's a yellow light - don't stop what you are doing, slow down and be more aware of your surroundings as you pass through the "intersection of fear and greed". Below the 200 day moving average is flashing red. Stop, check your portfolio for potential problems, consider risk mitigation options, then continue to proceed with caution. Finally, if SPY is trading below the 20 month (80 week) moving average. Stop. Implement your risk mitigation plan and wait for the signal to change.