For investors, the twelve months ended June 30, 2021, have been memorable. As you can see from the table below, only gold, investment grade bonds, and the U.S. dollar posted slight declines for the period. U.S. stocks had strong competition from REIT's, commodities, and emerging market equities. Foreign stocks (developed markets) weren't that far behind either. (Oil was in its own special category!)
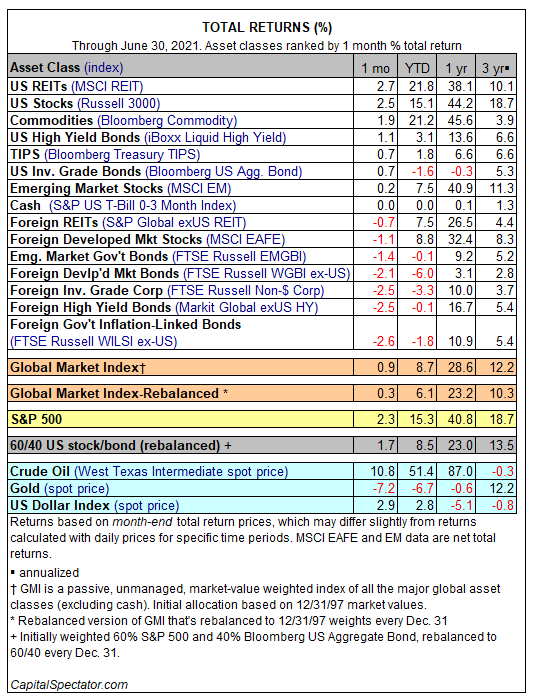
Of course, when you look at the past three years, the results are more subdued as they captured the gut-wrenching collapse of the financial markets in early 2020 when investors contemplated a pandemic-fueled global depression. Nevertheless, the past three years have been good for investors with only minor losses in crude oil and the dollar.
So where does the post pandemic market rebound leave us today?
Looking forward. . .
In a prior post, I used a Venn diagram to describe the basic framework I employ to evaluate stocks. I believe when you have all three factors working in your favor, your chances of success are high. Here it is again:
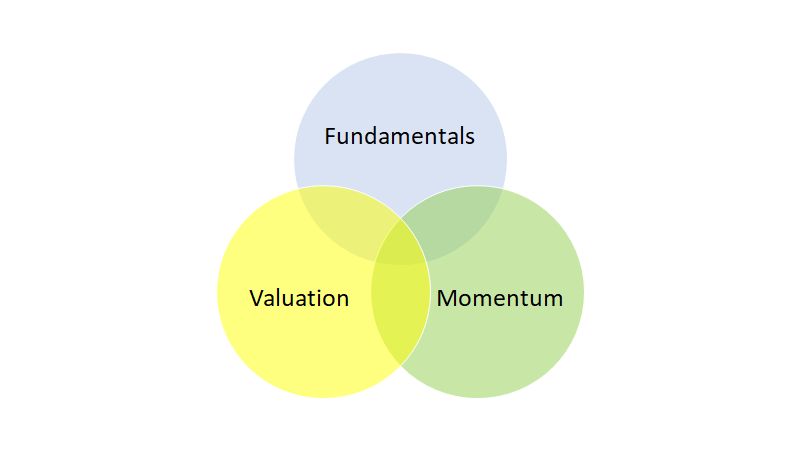
We can look at markets in a similar fashion.
Fundamentals:
There are all sorts of indicators we can use to gauge the health and direction of the economy: the trend in GDP, employment, inflation, interest rates, corporate profits, etc. I'm not going to go into all the stats (phew!) but I think it is fairly obvious that the U.S. economy has been rebounding sharply from last year's lockdown induced recession/depression. GDP is rising, employment is rebounding, corporations are more often than not, reporting strong profit growth. Interest rates remain fairly stable despite the acceleration of inflation. So at least for now, the economic fundamentals supporting the market look fine.
Valuation:
Here's where it gets interesting. . .
Most measures of market valuation describe a market that is at best fairly valued and at worst seriously over priced. In the last newsletter, I showed the Buffett Indicator - basically the total value of stocks divided by GDP. Here is is again:
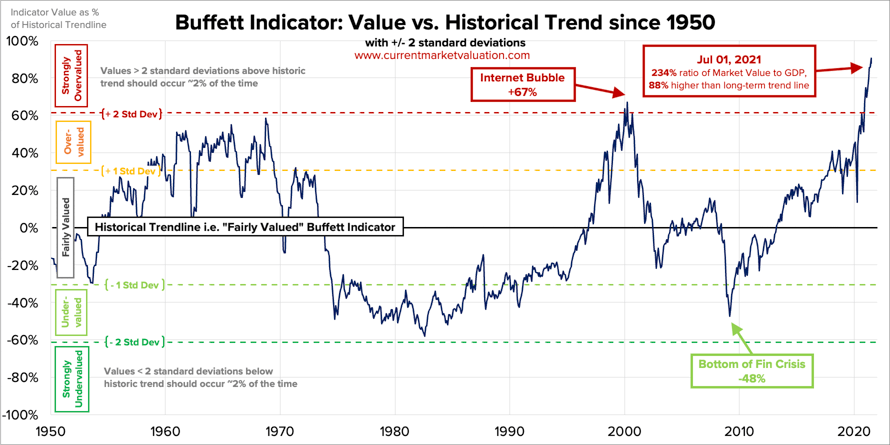
Making new highs and more than two standard deviations above its long term average, the Buffett Indicator suggests that the U.S. stock market is significantly overvalued.
The Shiller CAPE Ratio (described here) is a widely used measure of valuation. The data goes all the way back to the 1870's. Here it is plotted against interest rates:
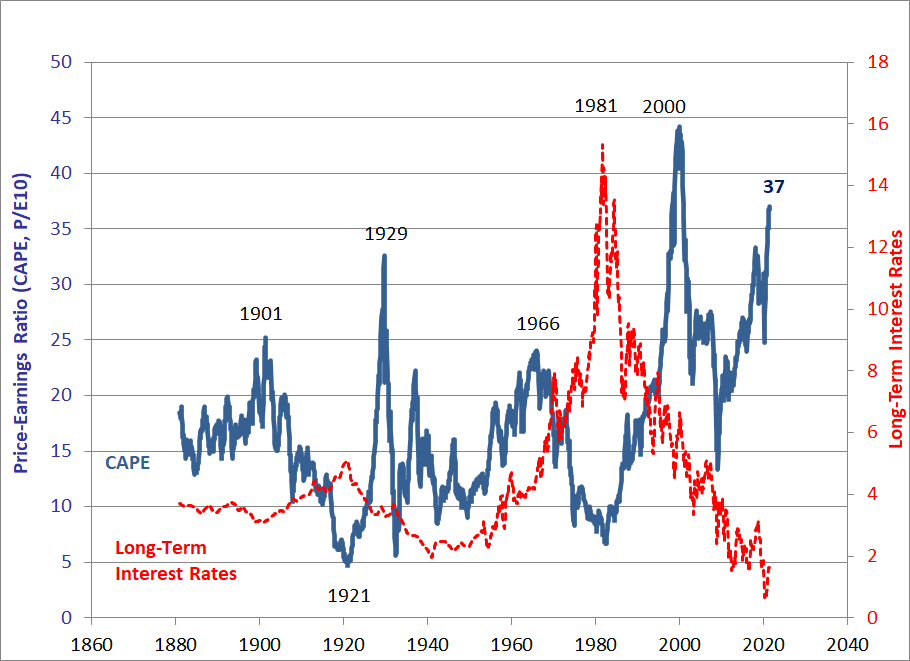
At 37, the CAPE ratio is the second highest on record. Only the 2000 peak is higher. Remember what happened that year? Before you panic, take a look below:
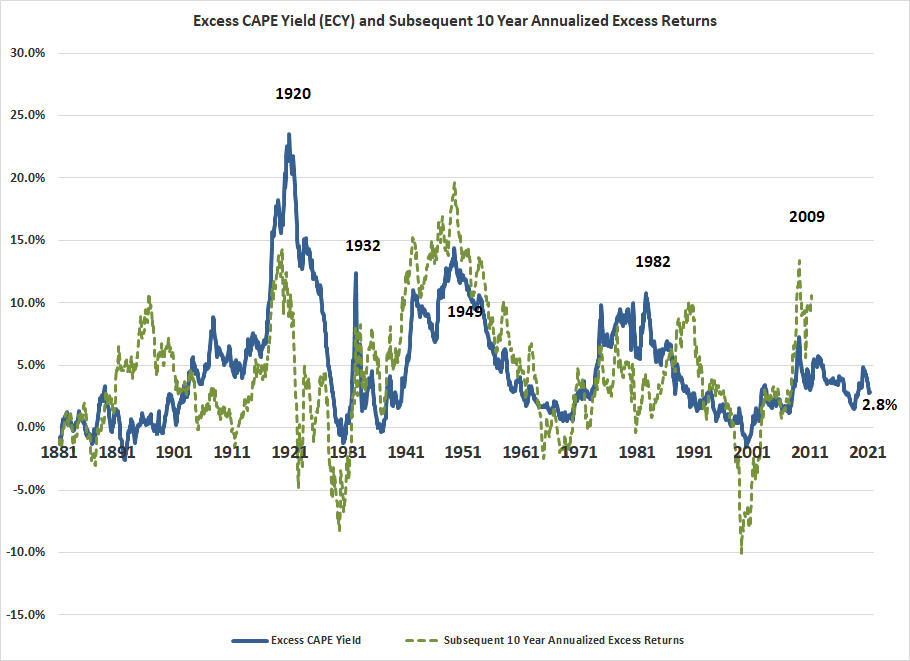
This chart above shows the same CAPE Ratio adjusted for the interest rates in place at the time (the blue line) - the Excess CAPE Yield (ECY). It also plots the subsequent 10 year excess returns of the market. You can see the fairly high correlation between the peaks and valleys of the ECY and subsequent market returns. Also note that when the ECY has fallen below 0%, subsequent market excess returns are generally negative.
Today, the ECY sits at 2.8%, about what it has averaged over the past several years suggesting that while not cheap, it is reasonable to expect positive excess returns over the next decade although perhaps not as high as we have been experiencing recently. Of course, a sharp rise in interest rates could drive the ECY down towards or below zero, so we'll need to watch long term rates.
Whether you look at Buffett Indicator, the CAPE Ratio, Excess CAPE Yield, or a simple market P/E, remember, these are historical measures. We don't know what the future holds for earnings or interest rates. What seems expensive today may be cheap tomorrow or vice versa.
So using these two indicators and some common sense, I think it is fair to say based upon what we know today, the market is somewhere between fairly valued, thus allowing for continued market gains, to significantly overpriced. Personally, I lean (cautiously) toward fairly valued.
Ok. Fundamentals seem fine. Valuations suggest that while the market is not cheap it doesn't seem so expensive that a bear market is imminent. However, there is one more factor we need to consider and this factor can sometimes overwhelm fundamentals and valuation. . .
Momentum:
Remember Newton's First Law of Motion which states (in part) that a body in motion will remain in motion unless acted upon by an outside force? Well, stocks can exhibit a similar pattern. Rising stocks tend to continue their advance until some outside force changes that trend. (It works the same on the way down.) We call this momentum.
There are many ways to observe or measure this momentum. I like to look at a longer term 20 month moving average of various market indices. In particular the S&P 500 and the equal weighted S&P 500. When these two measures of the stock market momentum are rising and the indices are trading above the moving average, market momentum is positive and stocks are likely (but not always!) to continue their advance.
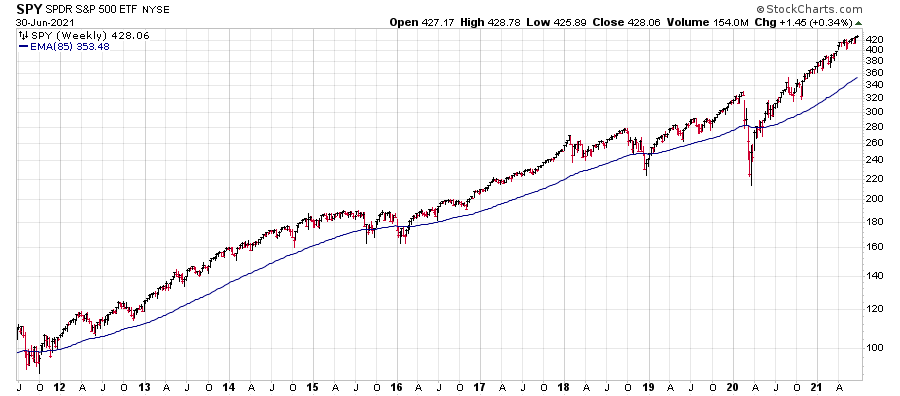
Here is a chart of SPY, an ETF which mirrors the performance of the S&P 500. You can see that SPY is trading above the rising moving average. (A careful reader will note that what is plotted is a 85 week moving average or about 20 months)
As you may know, the S&P 500 is a capitalization weighted index, meaning that the largest companies in the index (Apple, Google, Microsoft, Facebook, etc.) can have an exaggerated impact on the performance of the index. So I also look at the equal weighted S&P 500 to get a sense of whether the market is rising because of just a few stocks or that stocks more broadly advancing (a good thing!). Here's the chart of RSP, and ETF of equally weighted S&P 500 stocks:
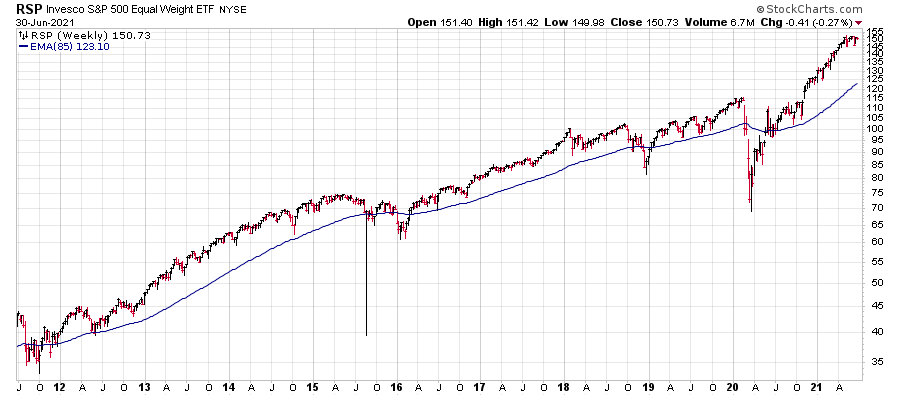
The chart of RSP looks a lot like SPY - trading above the rising moving average - a broad based advance.
So while we are likely to experience corrections along the way, these two indicators of momentum suggest further advances in the market.
Conclusion:
It's been a great twelve months for investors despite the pandemic. And it looks like conditions are still conducive for additional advances in equity prices (at least U.S. stocks). Recognize, however, that we are very likely to experience corrections and these favorable conditions will not stay that way forever.
Finally:
Another (short) Howard Marks video worth watching. You'll find it here: The Truth About Investing.
Please feel free to forward this newsletter to a friend. If you haven't already, you can subscribe here. There's no cost and you can unsubscribe anytime.