
September 4, 2022
As I begin writing on this first morning of meteorological fall (9/1/22), the S&P 500 is continuing its August swoon after rallying more than 17% from the June 16 lows to an interim peak on August 16. Readers of the weekly "Chart Attack!" may remember that sharp "relief" rallies of the magnitude we've just experienced are not unusual during a bear market.
(Sidebar: The classic definition of a bear market is a 20% peak-to-trough decline of the stock market. Personally, I don't think it's quite that simple. Beyond price declines, the duration and the breadth of decline matter. Given the carnage in both the stock and bond markets, it's hard to argue that we are not in the midst of a bear market.)
The recent resumption of the bear market has once again pushed the S&P 500 below 4,000 leaving stocks down more than 17% (even more if you adjust for inflation) so far this year. Only energy (+48%!) and utility stocks (+5%) have positive returns year-to-date. If you have the stomach for it, download all the latest numbers by clicking the arrow.
For those of you hoping for a September rally to bail us out, I've got some bad news. September has historically been the worst month of the year for stocks. Here is a chart from LPL Research illustrating the phenomenon.
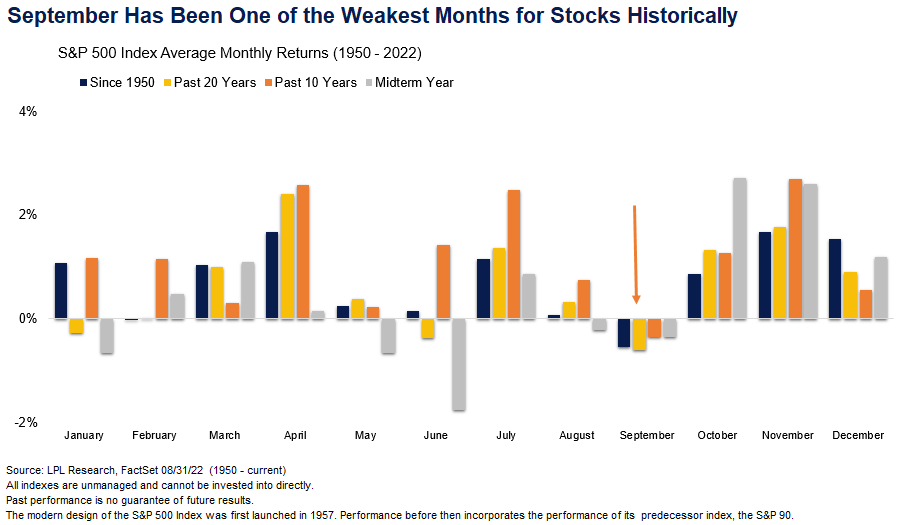
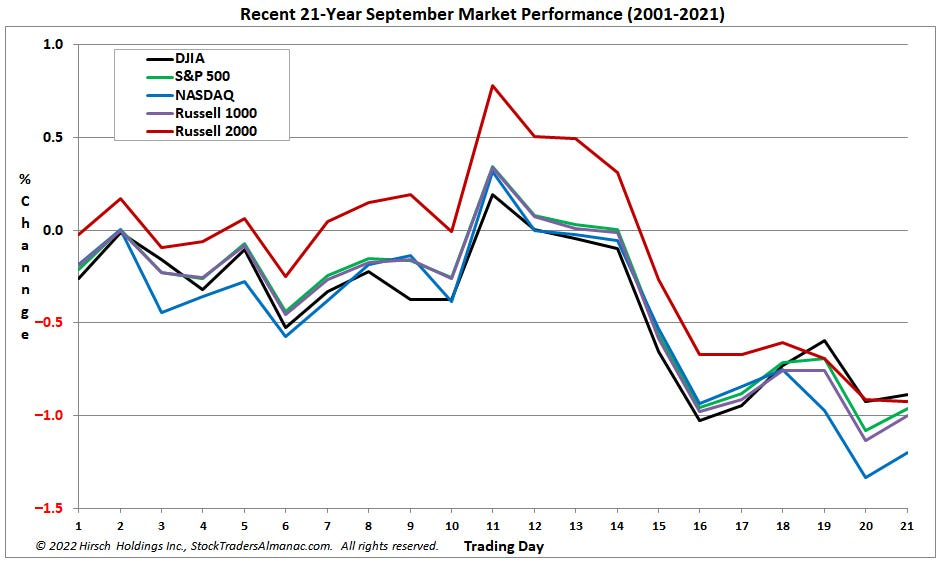
And be aware, most of September's swoon has typically occurred in the second half of the month:
Why was the market's June to August advance merely a rally in a bear market and not the start of a new bull market? Well, we can't know for certain but here are my concerns. Let's examine them in three categories: fundamentals, valuation, and momentum.
Fundamentals
Peter Lynch in his book "One Up On Wall Street" reminded the reader that stock prices follow earnings over time. For the market, aggregate earnings growth, both in magnitude and direction, is a key determinant of its health.
Despite strong employment (payrolls rose 315,000 in August), the economy has slowed making it difficult for corporations to grow their revenues and profits.
(Sidebar: Employment is a lagging indicator and will typically continue to rise in the early stages of a recession.)
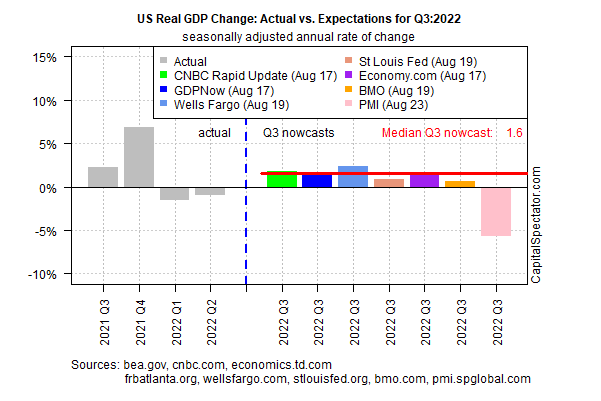
GDP growth was negative in both the first and second quarters, the classic definition of recession. While a rebound is likely in the third quarter, as shown in this recent survey of GDP "nowcasts", it may be short-lived.
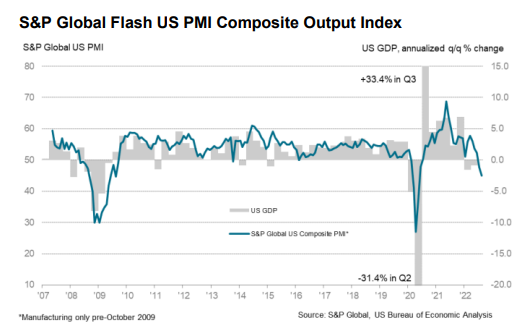
More companies are reporting disappointing results and forecasting a more difficult business environment. The S&P Global US PMI is continuing to erode consistent with a weakening economy.
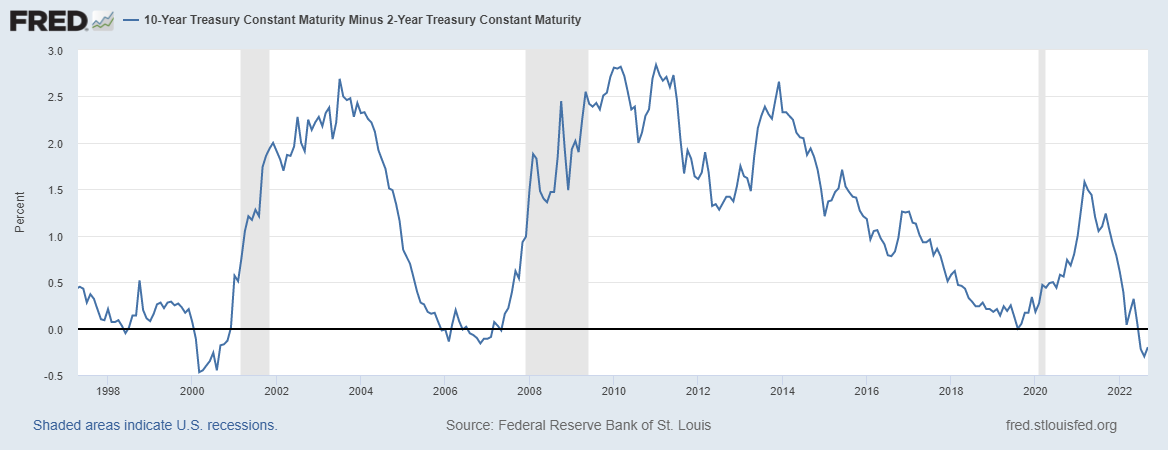
Another recession warning is an inverted yield curve. The 10-2 year U.S. treasury yield curve shown here has been negative for several weeks.
Inflation, while perhaps peaking, remains a problem, squeezing consumer budgets, raising the costs to run a business, and putting pressure on profit margins.
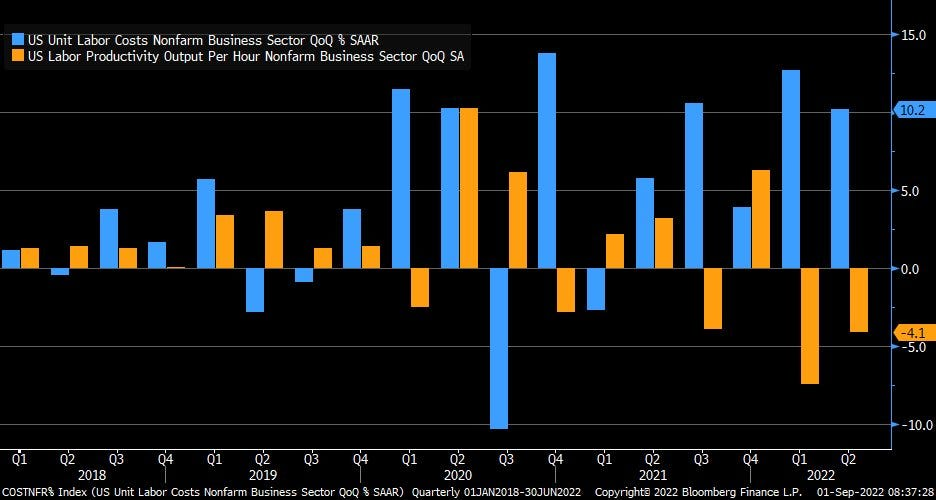
Here, for example, is a chart of unit labor costs and productivity. For the last two quarters, unit labor costs have risen at a 10%+ annual rate while productivity has fallen. In effect, companies are paying more to produce less. Unless passed on to consumers in the form of higher prices, profit margins will be squeezed.
It appears that investors are just now adjusting their expectations downward for revenue and earnings growth.
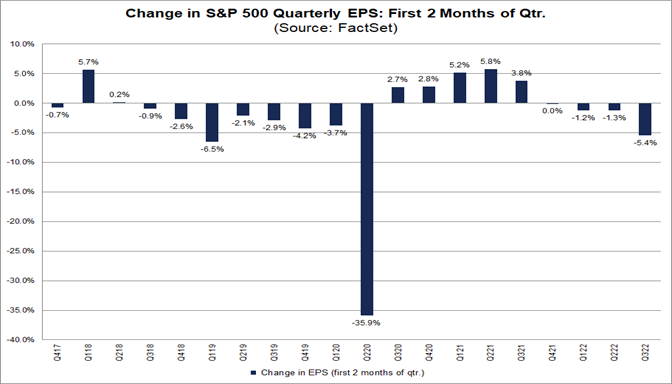
I'm guessing that earnings for the S&P 500 companies will continue to fall short of expectations. If so, the consensus estimates for S&P 500 earnings of $227 in 2022 and $236 in 2023 will continue to adjust downward, perhaps closer to $200 in both years. (Remember the $200 earnings figure as we'll be using it below.)
Valuation
Share prices are determined by their earnings and some multiple applied to those earnings, typically the P/E ratio. P/E ratios are heavily influenced by the level and direction of interest rates. High and/or rising rates tend to depress the P/E ratio.
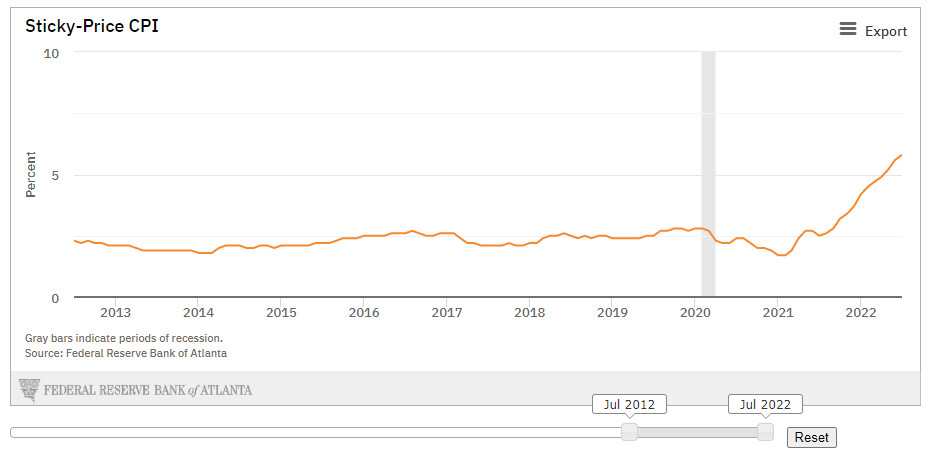
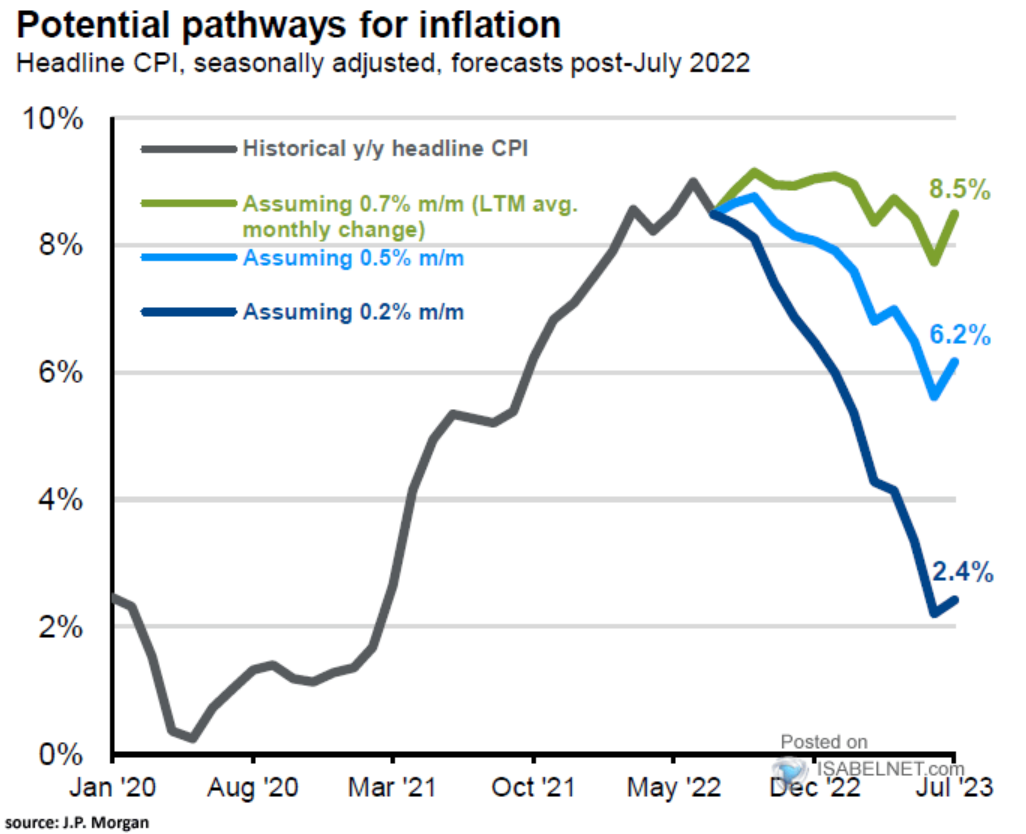
Inflation may be peaking but it's still high by historical standards and will likely remain above 5% into the next year. The Atlanta Fed maintains the "Sticky-Price" CPI representing a basket of goods and services whose prices are slow to move, up or down. As of July 2022, the Sticky-Price CPI stood at 5.8%.
J.P. Morgan provides three different scenarios for inflation in this graph. Note that only very mild inflation going forward will get us close to the Fed's 2% target by mid-year 2023.
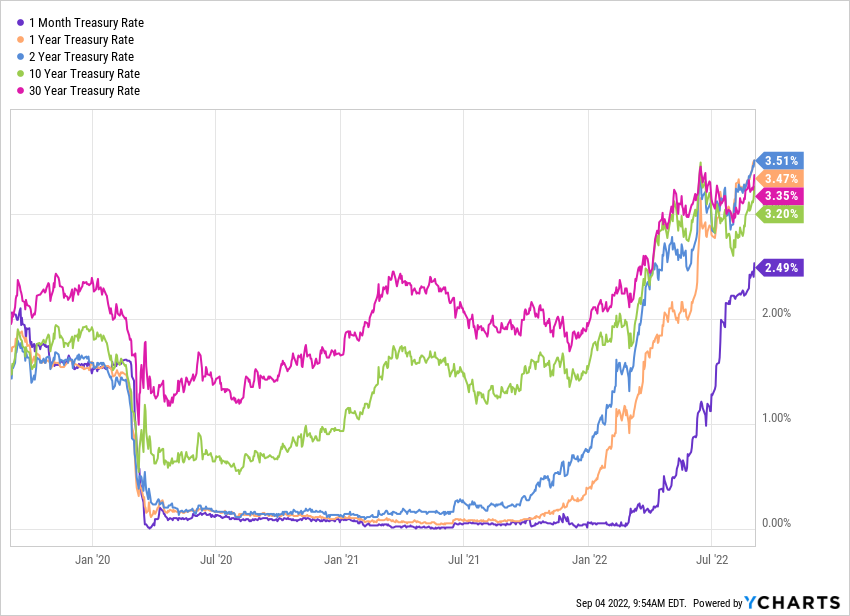
Interest rates are still trending higher as the Fed continues to raise short-term rates in an effort to contain inflation. Long-term rates have been heading higher as well. The Fed's reversal of quantitative easing (QE) will also force longer-term rates higher as the Fed's bond holdings are sold into the market. Not to mention the federal government's insatiable demand for credit. Rising rates put pressure on equity valuations, raise the cost of capital for business, and further squeeze consumer budgets. I suspect we will still be discussing rising rates well into the new year.
Momentum
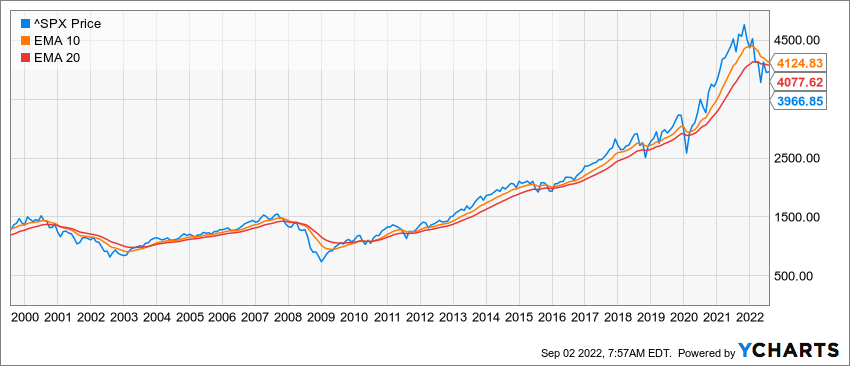
Stocks, like other assets, exhibit trend-following behavior. We can illustrate that behavior using moving averages. Rising moving averages suggest the market is in an uptrend. Falling moving averages indicate a downtrend. I tend to look at longer term moving averages to avoid the noise and false signals shorter term moving averages can produce.
As of August 31, the S&P 500 is trading below our favorite long-term moving averages (specifically the 10 and 20-month exponential moving averages) and both moving averages are below their recent peaks. This suggests stocks are now in a downtrend which will likely persist until stocks begin to trade above those moving averages.
Conclusion? It looks like all three categories, fundamentals, valuation, and momentum are currently working against us. So where are we headed?
Remember this table? It shows various P/E ratios given inflation and tax environments experienced over the past 100+ years.
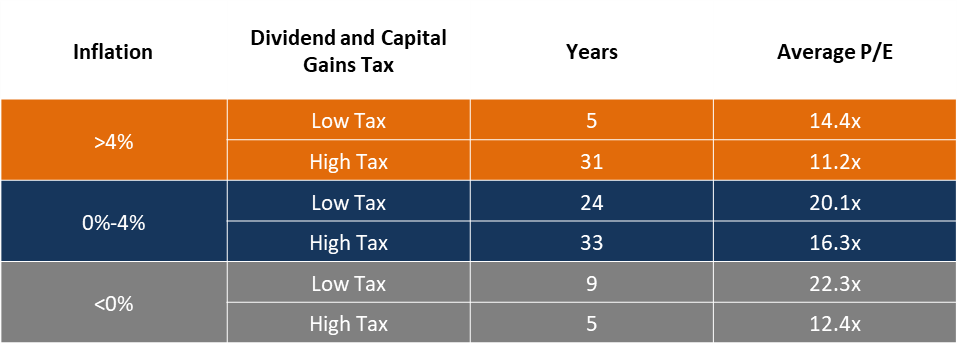
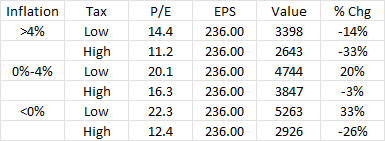
I have recreated the table adding expected earnings to compute a potential value for the S&P 500 and percent change from the August close of 3955. First, here are the results assuming consensus eps expectations of 236.
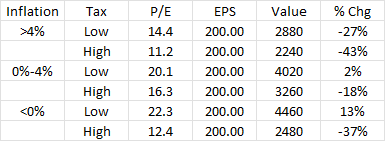
Now here's the same table assuming just $200 of earnings for the S&P 500 which in my view is closer to the mark than the current consensus forecast.
It's fair to say that inflation is running above 4%. Tax rates, thankfully, haven't changed much. However, the recent 1% tax on share buybacks (effectively another tax on dividends) is a warning that the trend in tax rates is up.
Thus, we should look to the upper right corner of the two tables for our forecast. Those values range from a low of 2240 to a high of 3398. The middle of that range is approximately 2800, about 30% lower than today's level, and representing a peak to trough decline of approximately 40%. To put this in perspective, since 2000 we've had two major bear markets -49% ('00-'02) and -57% ('07-'09).
Importantly, this is a forecast based on just two factors: inflation and taxes. There are many other factors to consider which could cause this forecast to be too optimistic or (hopefully) too pessimistic.
However, I do believe the result of this analysis supports the view that we are currently in a bear market.
What should you do if you agree we're in a bear market? You're going to love the answer...
It depends.
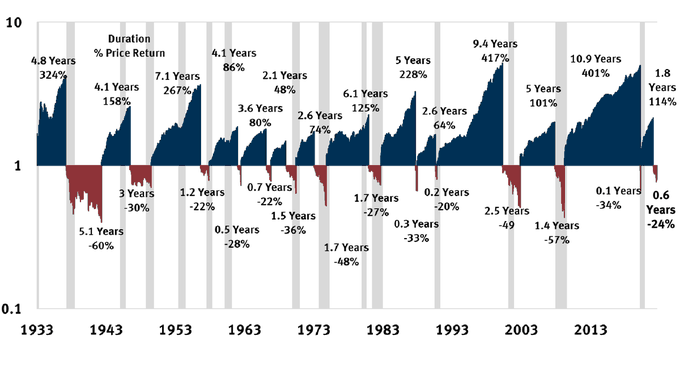
The 2022 bear market is now eight months old. The average bear market lasts about eleven months. Bear markets rarely last more than two years with the two longest, 9/7/1929 - 6/1/1932 and 3/24/2000 - 10/9/2002, lasting 998 and 929 days respectively. Bear market declines since 1929 have ranged from -86% ('29-'32) to -19% (several). Here's a graphical look at the data.
Let's assume this bear market lasts another twelve months. Depending upon your time horizon, financial situation, risk tolerance, and other factors you may not need to do anything. Or, you may wish to dial back your risk, focusing on high-quality, dividend-paying stocks or perhaps even raising some cash now that you can actually earn a return on that cash. You should also consider selling your losers to offset any capital gains you have realized so far this year. And if you work with a financial/investment advisor, now's the time to get in touch, review your plans, and implement any changes.
If you are considering picking up some bargains in this bear market, I would simply caution that stocks you think have finally bottomed can still go lower particularly if the company's fundamentals are being hurt in the recession. Perhaps, consider buying a small initial position until you have confidence the worst of the bear market has passed.
A final thought on this subject. This bear market will end. Subsequent returns can be dramatic and it would be a shame to miss the rebound. So tread as lightly and as carefully as possible as you navigate this bear market. After all, you don't want to be that salmon!
How's Your Retirement Plan?
I recently tried out the NewRetirement.com website which offers a comprehensive set of tools to guide you through most aspects of financial planning. The value of NewRetirement.com is not just building a plan to get you to and through retirement but the ability to monitor and adjust your plan as situations change.
Many of you may use a financial planner, investment advisor, and/or accountant to assist you with the complexities of developing and managing your financial plan. Even so, using NewRetirement.com can help you better understand your advisors' recommendations or help you prepare for discussions with them.
The $120 per year cost seems quite reasonable particularly given the comprehensive nature of the product. NewRetirement offers a fourteen-day free trial if you sign up. Take a look. (And no, I'm not getting paid to promote NewRetirement. I really think it's useful.)
Updates
I hope you are finding the weekly Chart Attack!s interesting. We are now sending Chart Attack! to all Under A Buttonwood Tree email subscribers. That's right, you no longer need to request it. However, if you do not want to receive Chart Attack! in your email, send me a note at under.a.buttonwood.tree@gmail.com. You can always read the weekly issues on our website's homepage.
The Under A Buttonwood Tree publishing schedule will remain variable but expect about one issue per month going forward.
And Finally!
Thank you for reading this issue of our newsletter! Please feel free to forward it to a friend.
Visit our Home Page for access to past issues of Under A Buttonwood Tree and Chart Attack! as well as other resources.
Did someone forward you this email? Want your own copy of "Under A Buttonwood Tree" and "Chart Attack!" sent directly to your inbox? Then click the subscribe button. It's free!
I'm always interested in your feedback, ideas for topics, and questions. So please click the button below.
If for some reason the button doesn't work, please email us at: under.a.buttonwood.tree@gmail.com