April 2, 2023
A much better week!
I discovered a new way to store and catalog the charts I collect. Hopefully, last week's problems will soon be a distant memory!
So let's get started with this week's harvest of charts, graphs, tables, and miscellany with brief comments.
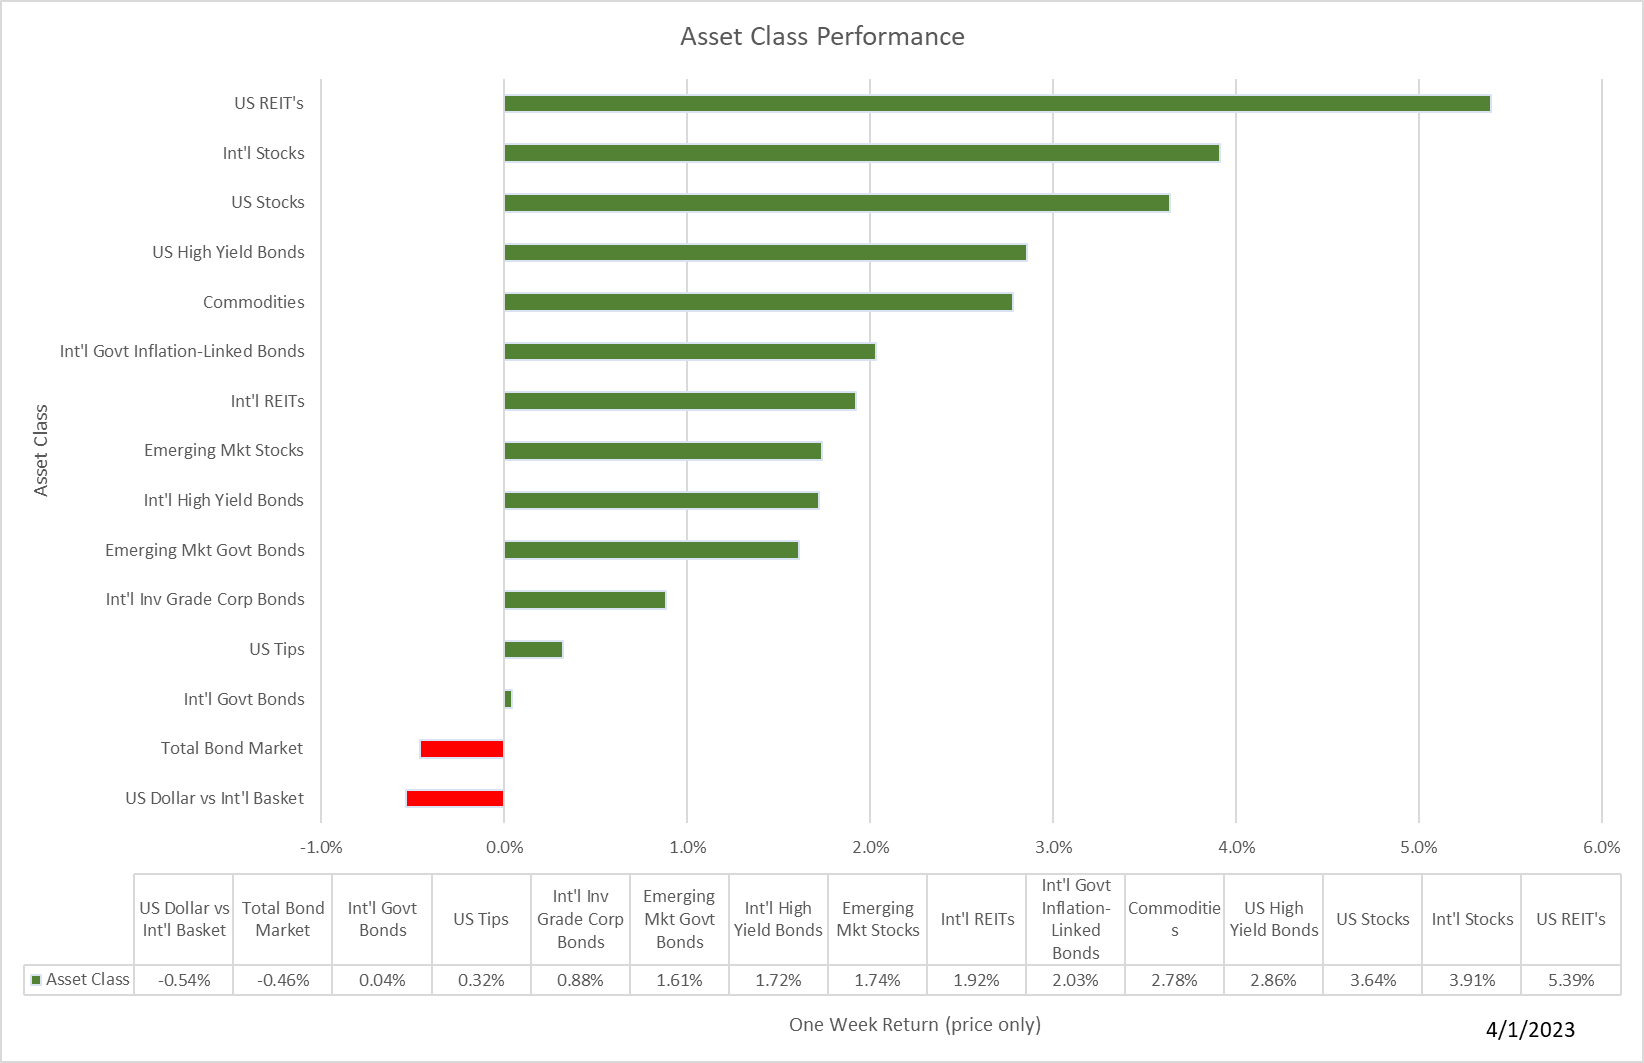
Stocks and bonds rallied on better news about inflation and the banking crisis.
Year-to-date results show the same positive trend.
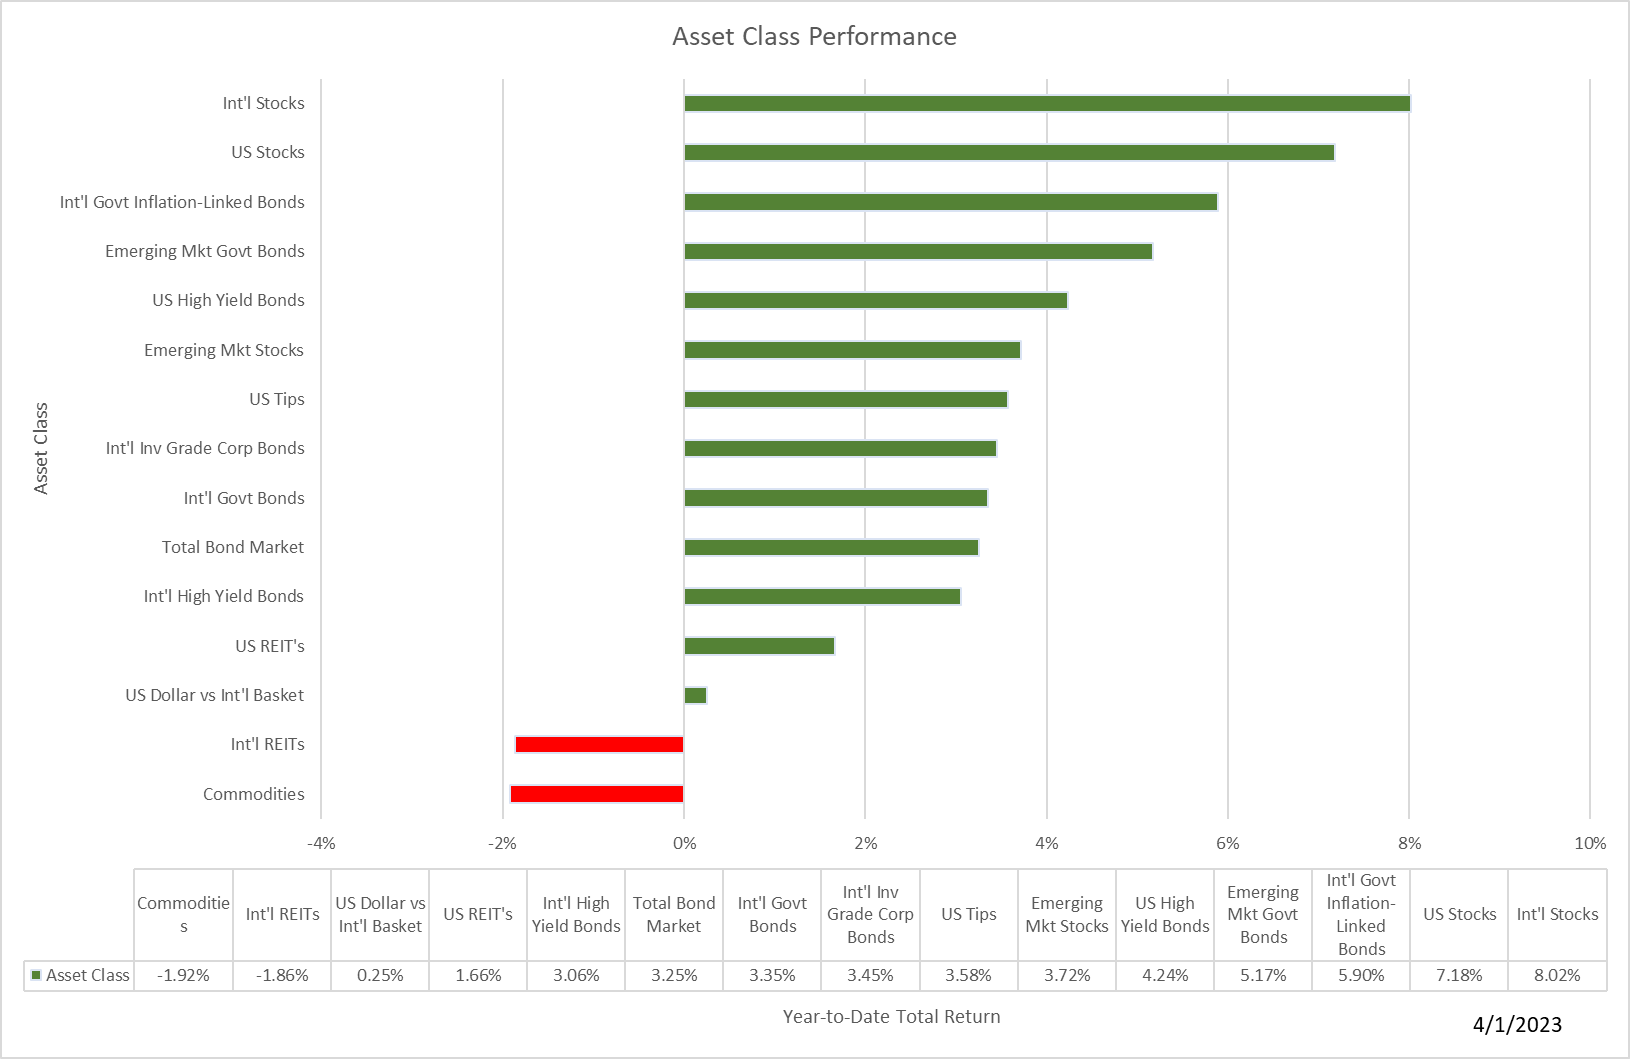
Download all the details in our Market Update report.
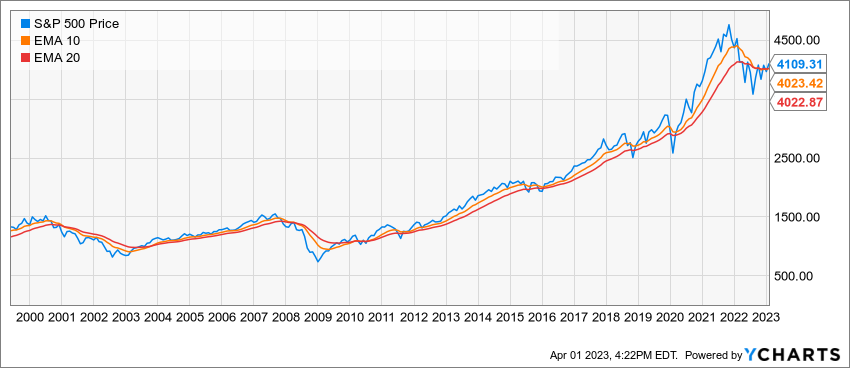
Thanks to a strong March, the S&P 500 has now traded above (albeit, just above) our favorite long-term momentum indicators for two months in a row, suggesting the 2022 bear market is drawing to a close. Here's the chart:
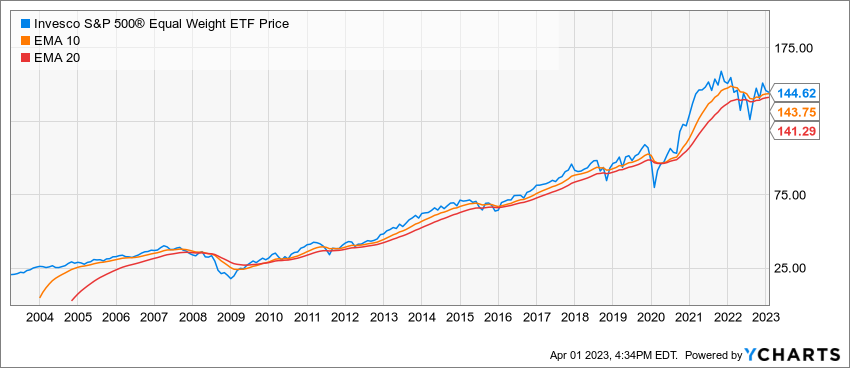
The equal-weighted S&P 500 has a similar, favorable pattern:
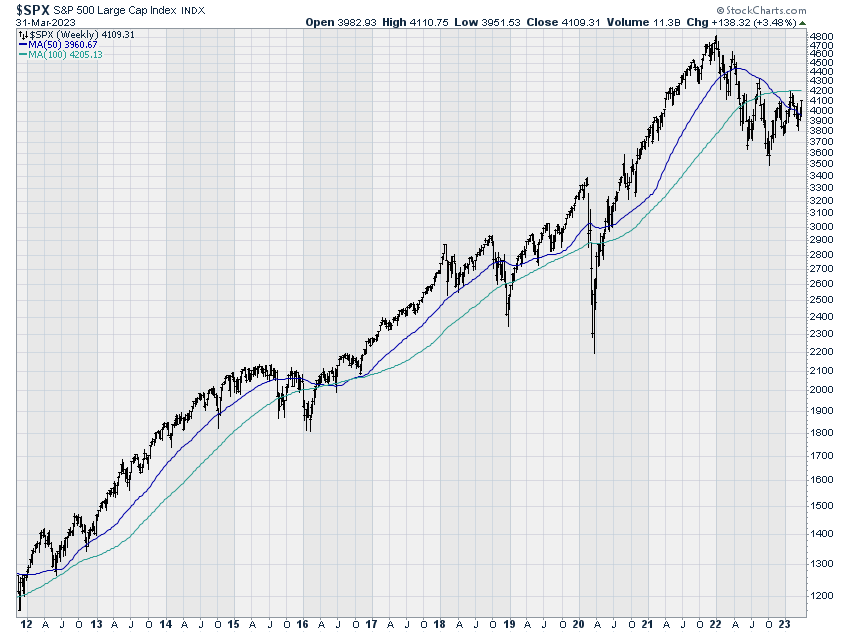
The weekly chart looks pretty good as well. Ideally, I'd like to see the market trade above the 100-week moving average (now around 4200) as well but directionally, it sure looks like a positive trend is building.
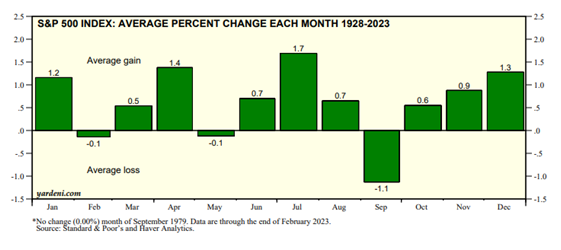
Another reason to be optimistic - April tends to be one of the strongest months of the year. Take a look at this chart of almost 100 years of market data.
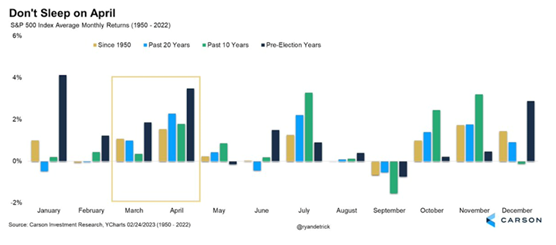
Here's the same information going back to 1950 with more granularity.
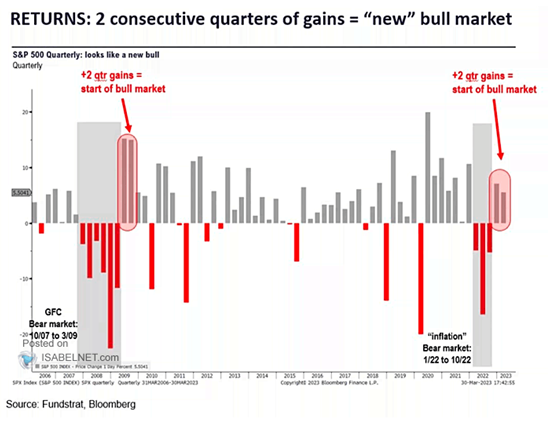
Still a skeptic? Perhaps this will convince you. (Personally, I think there are some problems with this analysis - limited data and the last bull market had four consecutive up-quarters to get started, not two - but hey, it's a start.)
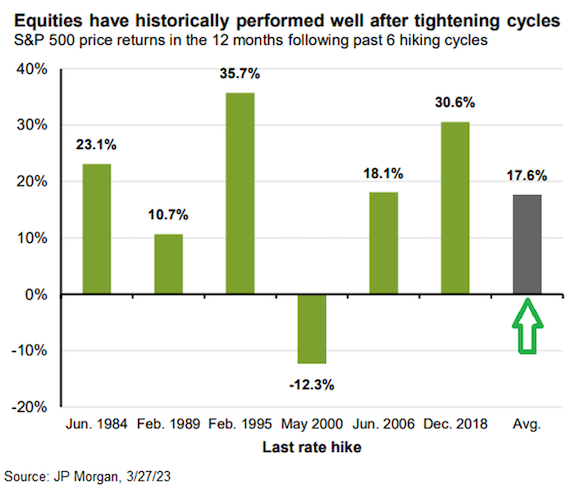
Suppose the Fed finished raising rates at the March meeting. What happens next for stocks? Looks like they are more up than down...
Here's a look since 1929.
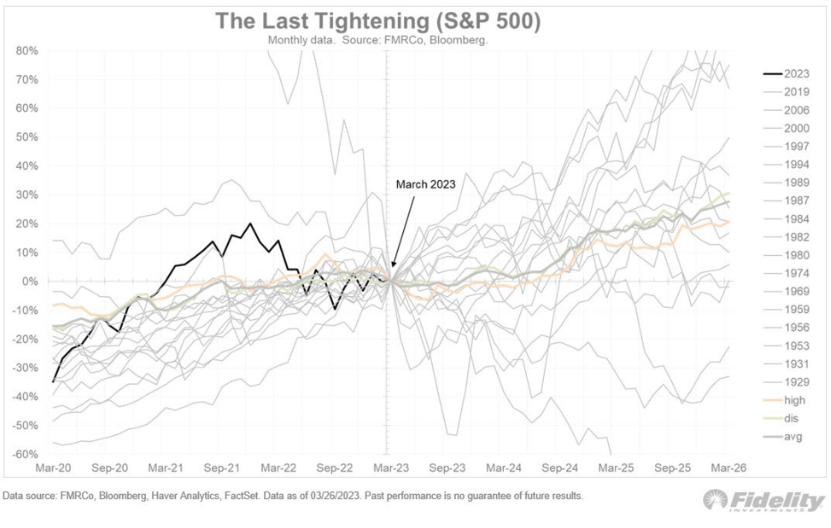
And here is the more recent experience.
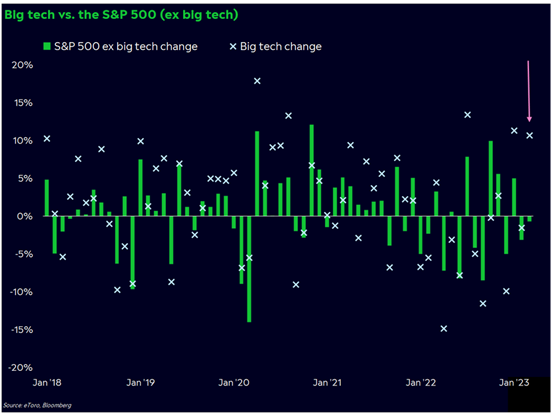
So you don't get too excited, it looks like big-cap tech stocks are propelling the market higher, and without their performance, the S&P 500 would be down a bit.
That's enough on stocks. Now for some quick hits on the economy.
First off, a bit of good news on inflation:
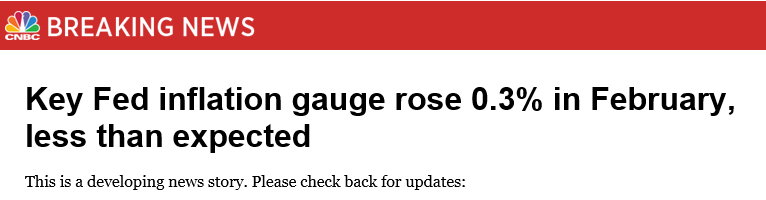
This is the chart of the headline and core index through February. While it's still higher than the Fed's target, the softening of the index may give them room to pause rate hikes...
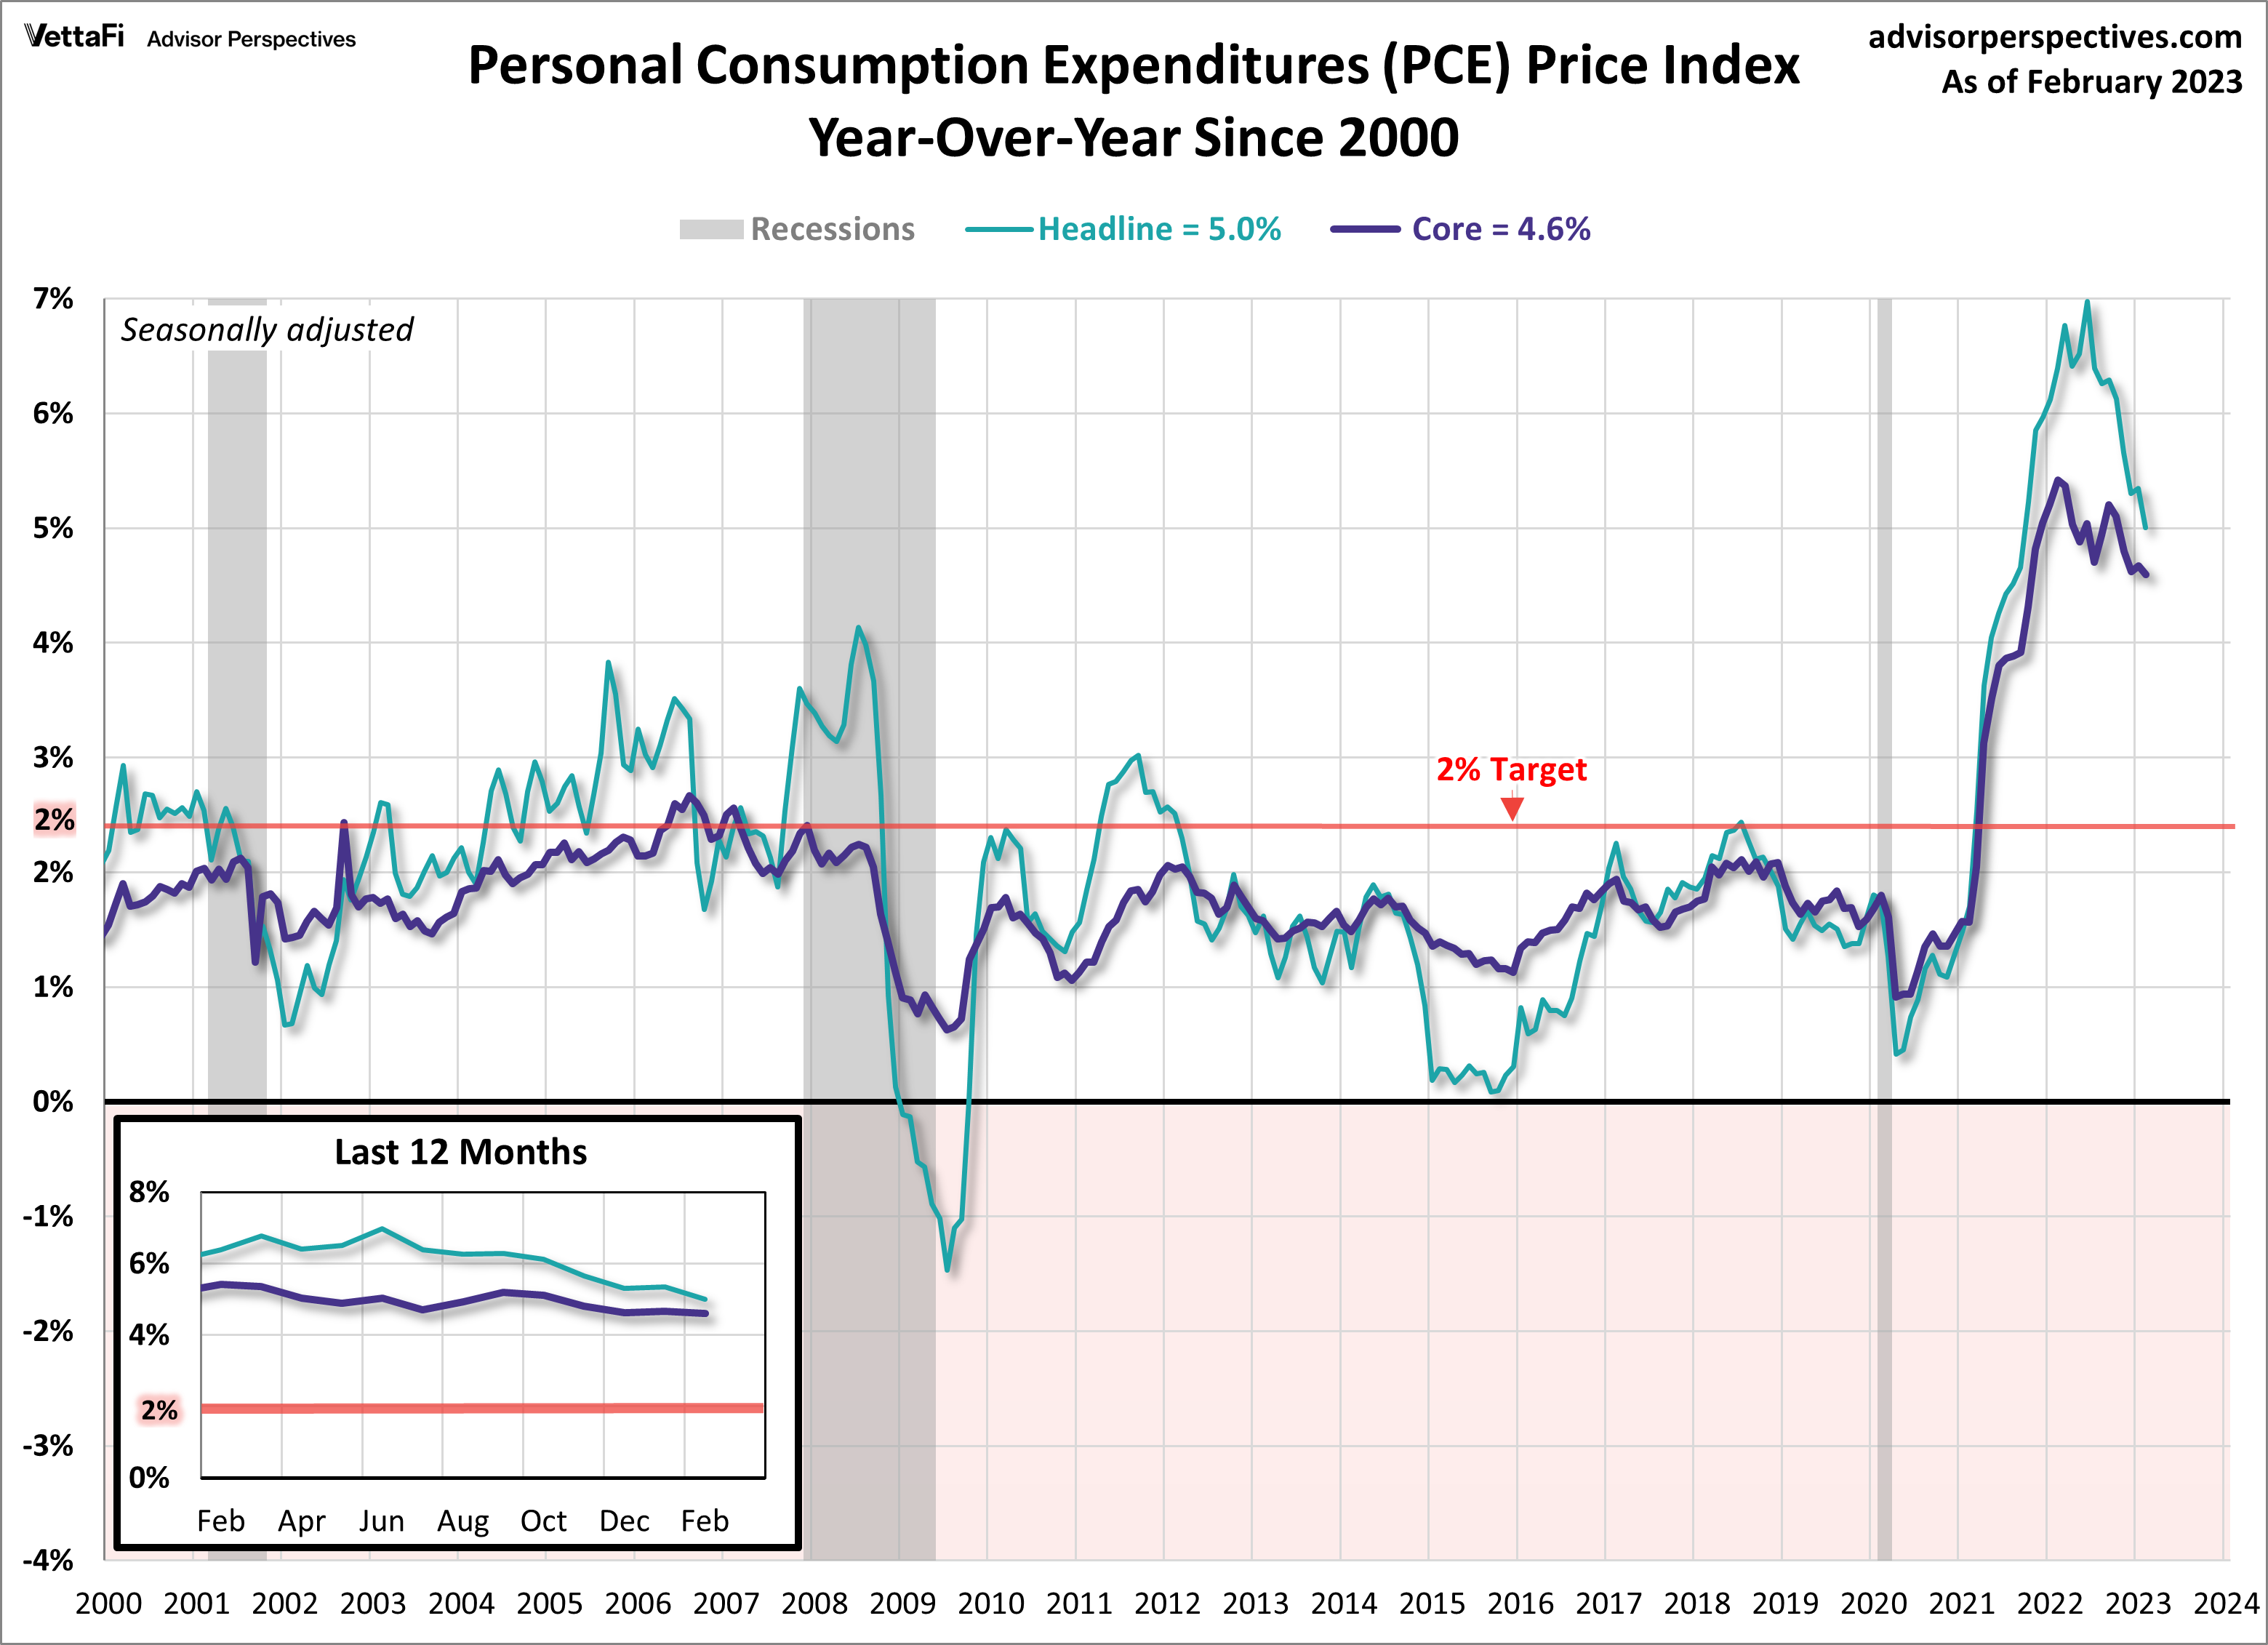
And a pause would be good news for the market as stable or falling rates usually translate into stock market gains.
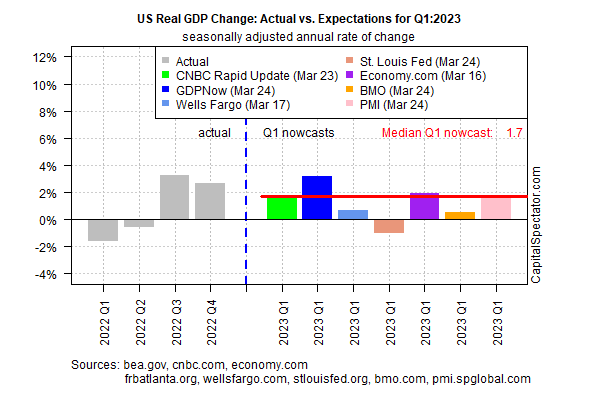
Looks like GDP will be up again in the first quarter of 2023, albeit growing slower than last quarter. Here's a summary of recent forecasts:
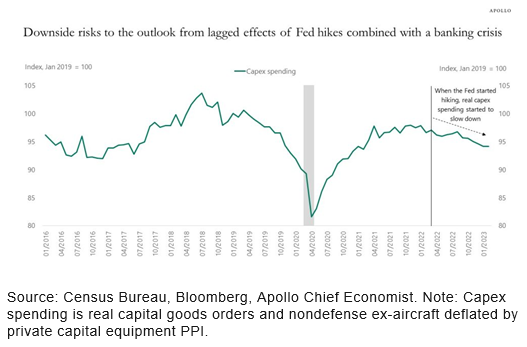
But here are some issues to consider:
The banking crisis will have a depressing effect on the economy possibly knocking a percent off GDP growth in upcoming quarters.
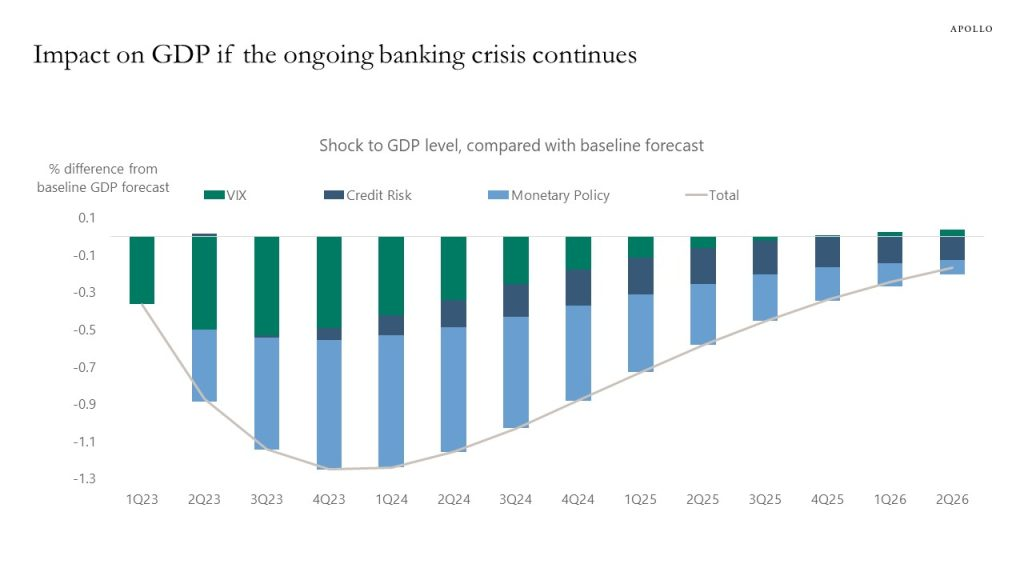
And remember, many of the actions of the Fed have lagged effects so even if rate increases are paused or ended the impact of last year's hikes will still be felt throughout the economy.
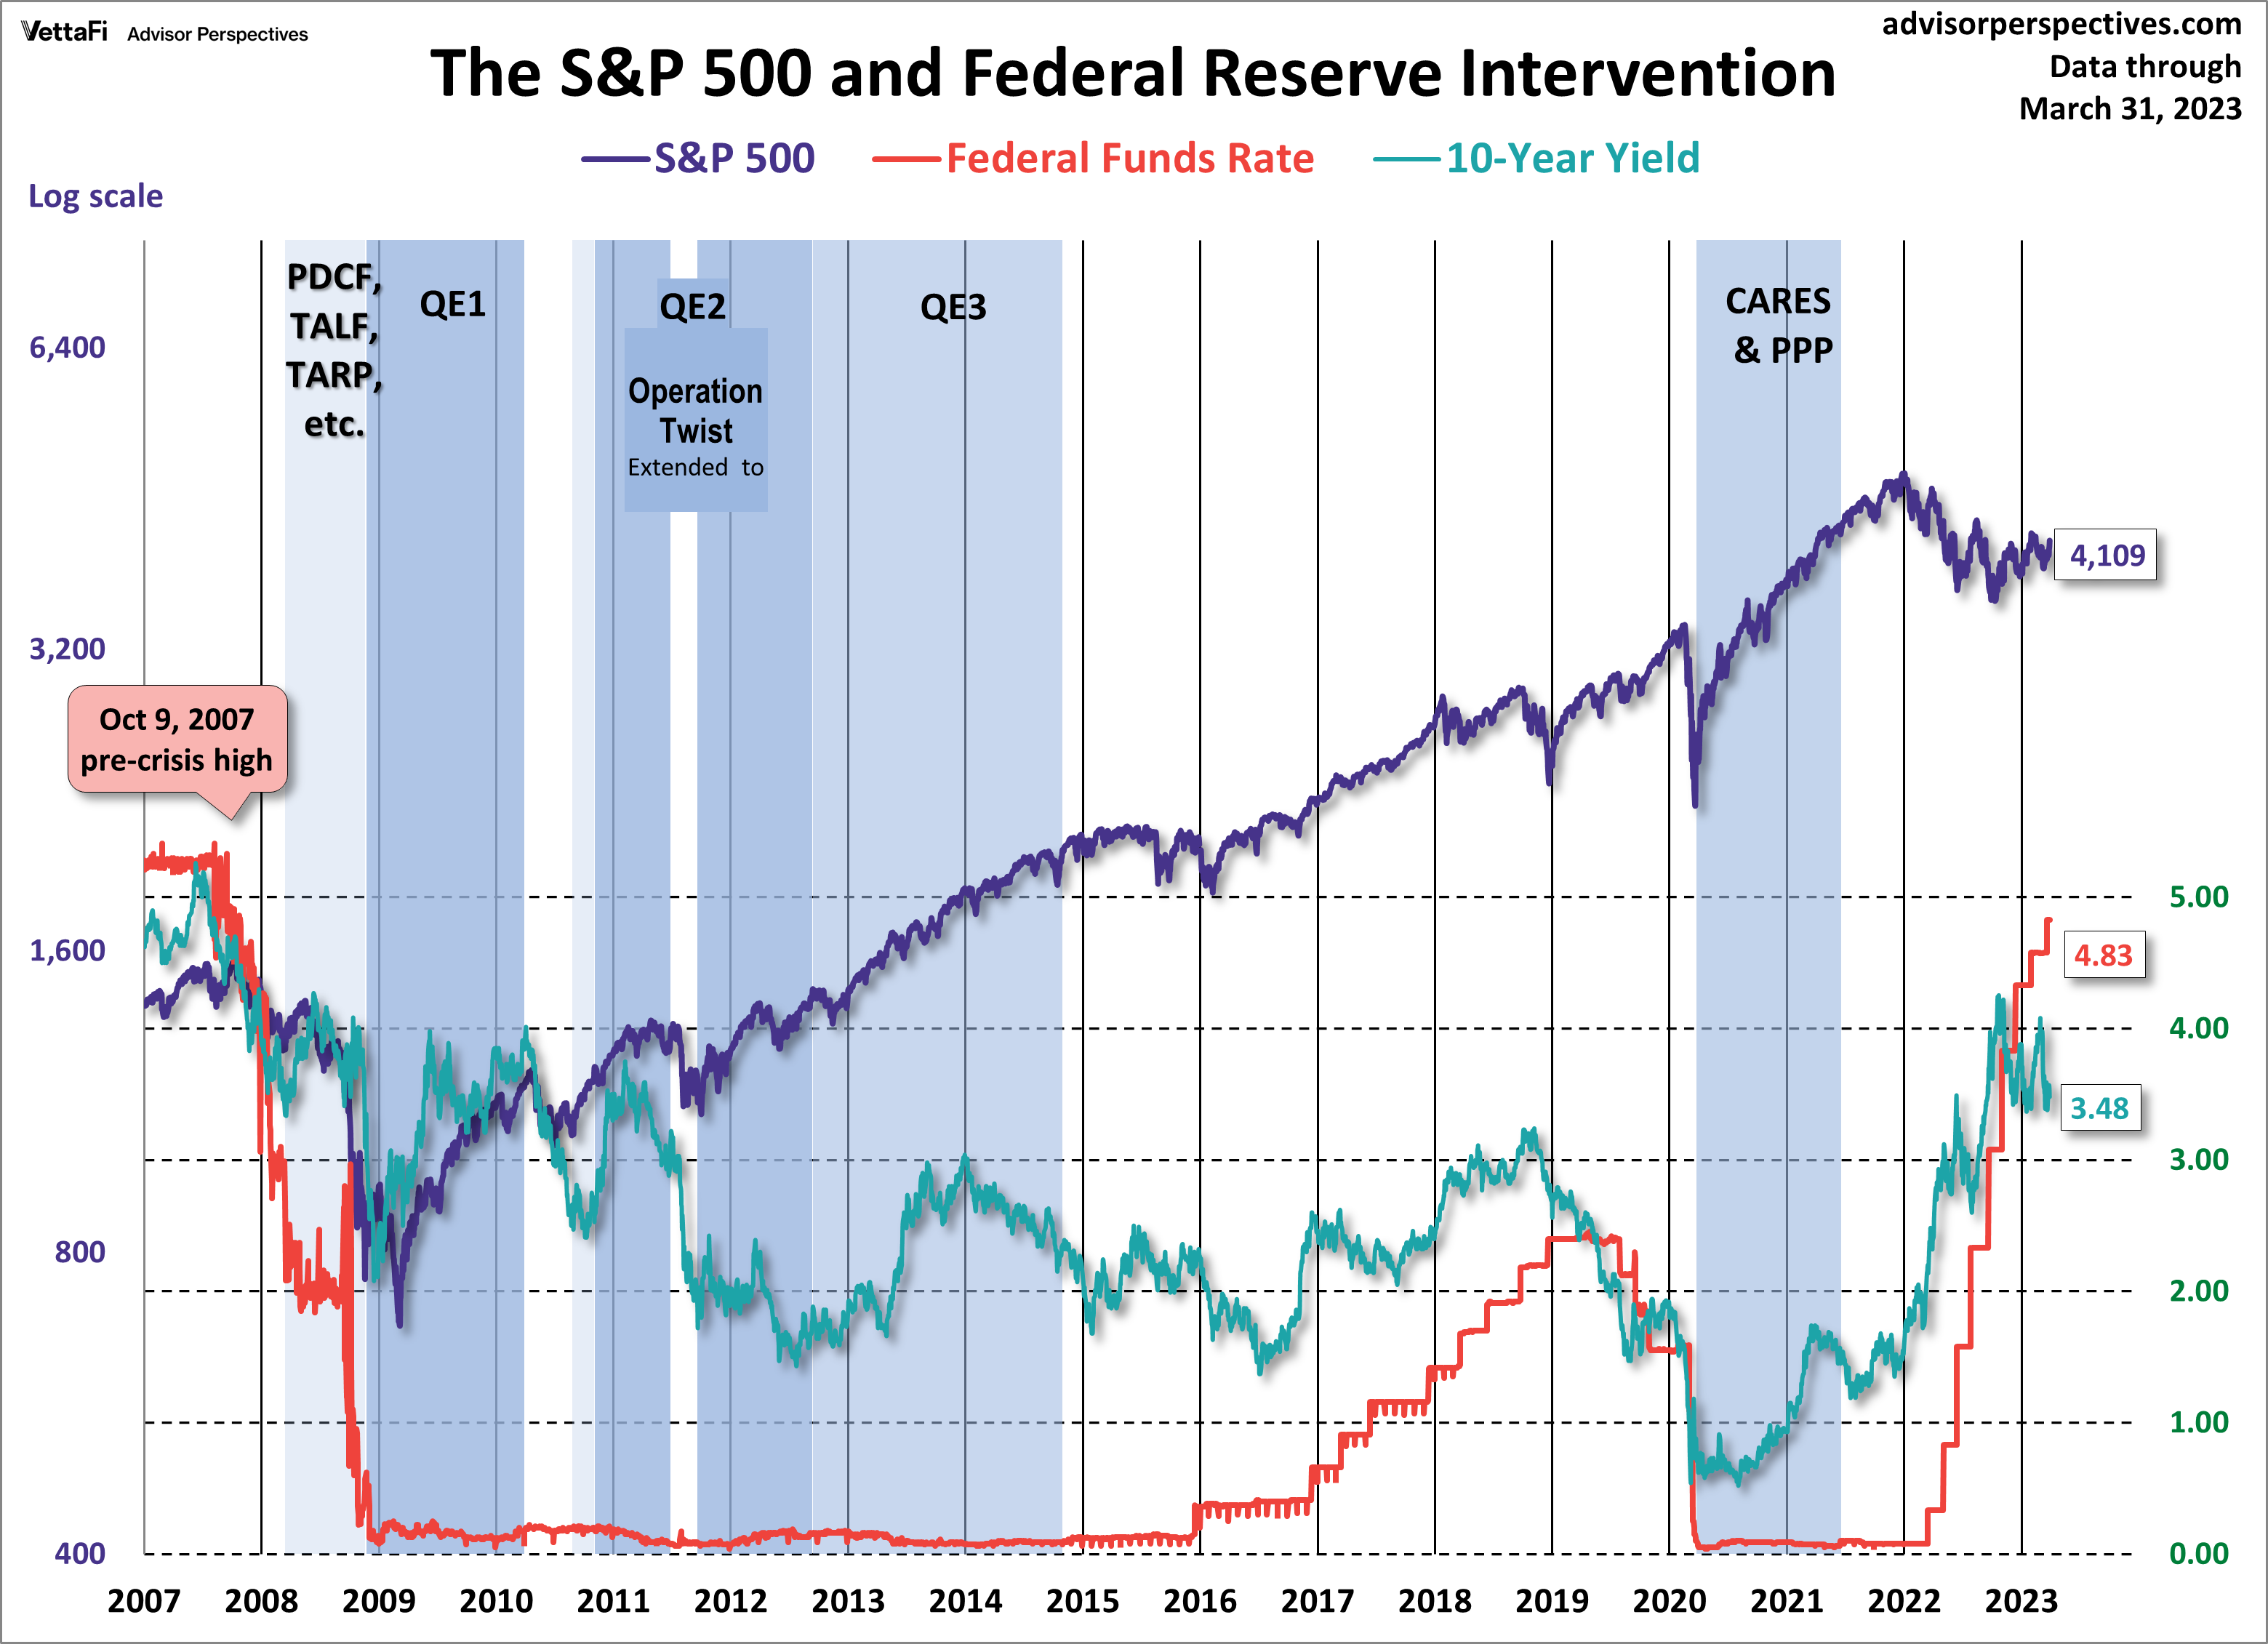
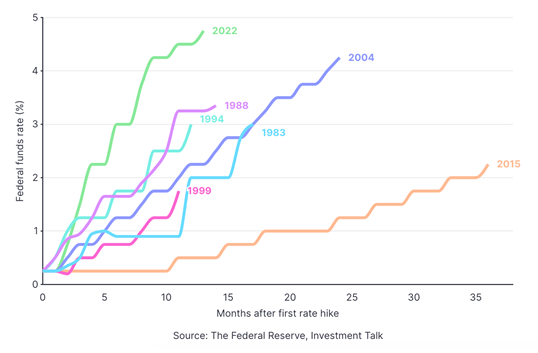
In case you forgot how rapidly rates have risen...
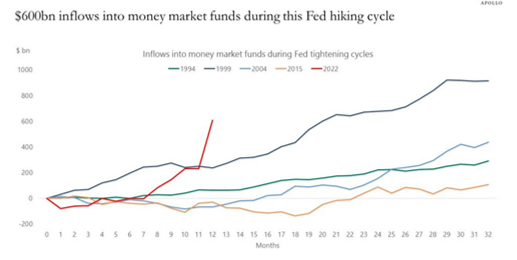
Here's one impact of those rate hikes - a dramatic increase in flows into money market funds and out of the embattled banks.
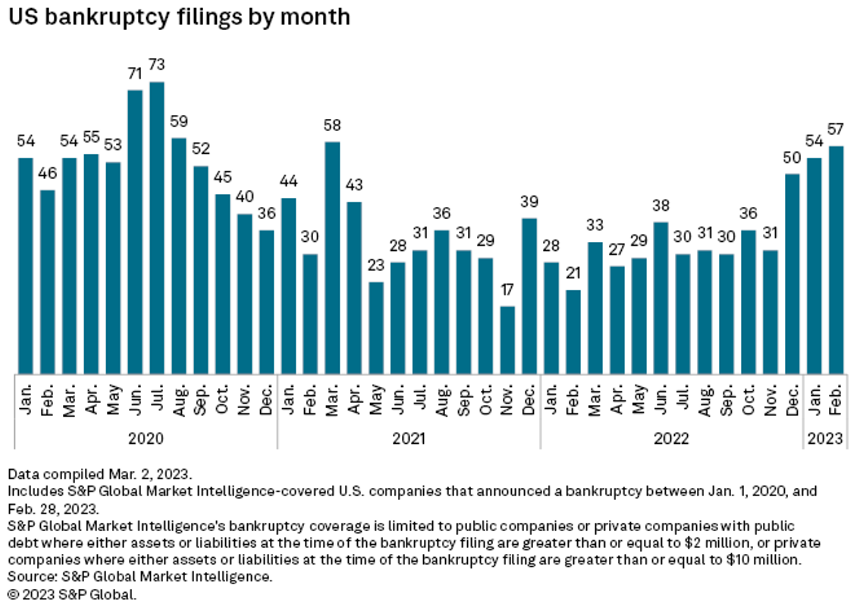
Another impact: corporate bankruptcies are rising.
Thank you for reading! I hope you found something of interest in this week's Chart Attack! Find more Chart Attack!s on the Under A Buttonwood Tree homepage.
Chart Attack! is only available to subscribers of our newsletter, Under A Buttonwood Tree. If you're not a subscriber and would like to be, click the subscribe button and sign up. There is no cost for either the newsletter or Chart Attack! (You can also subscribe on the Home Page.)
Are you receiving too many emails and would rather read Chart Attack! on our website? Just let me know by email and you will be removed from the mailing list.
Our email address is under.a.buttonwood.tree@gmail.com
Remember, Chart Attack! is only available to subscribers of Under A Buttonwood Tree, so be sure to subscribe for access!