Sept 12 - 18
Throughout the week, I collect charts, graphs, tables, and other items of interest, some of which may be used in an upcoming newsletter. They are displayed below with brief comments.
Warning! You may want to remove any sharp objects before reviewing the charts below.
Ugh! Another tough week for Wall Street:
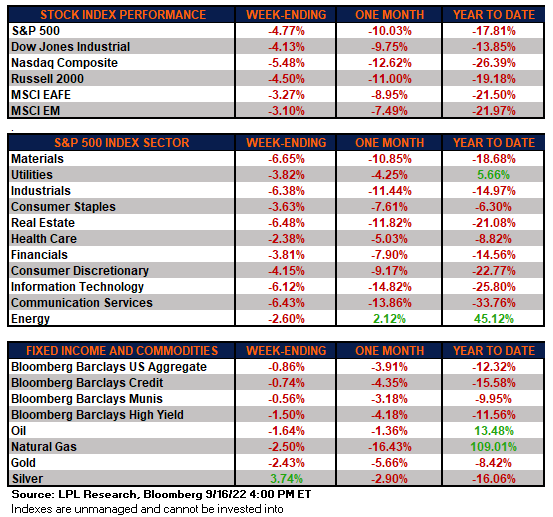
Download a more detailed review of last week's performance:
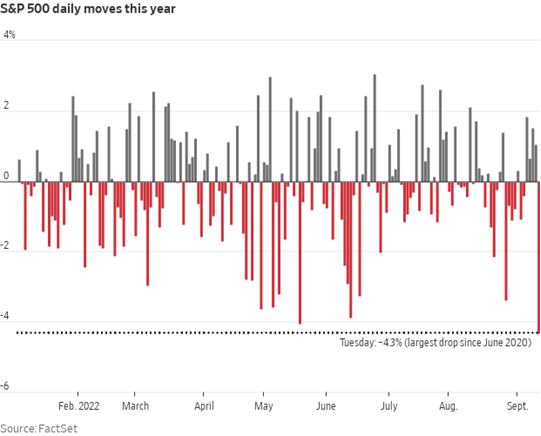
Most of the decline occurred on Tuesday, Sept. 13.
Take an early look at the front page of The Wall Street Journal https://t.co/V12SjqCDXp pic.twitter.com/bzLWpW7mUq
— The Wall Street Journal (@WSJ) September 14, 2022
Tuesday's decline was the worst in more than two years.
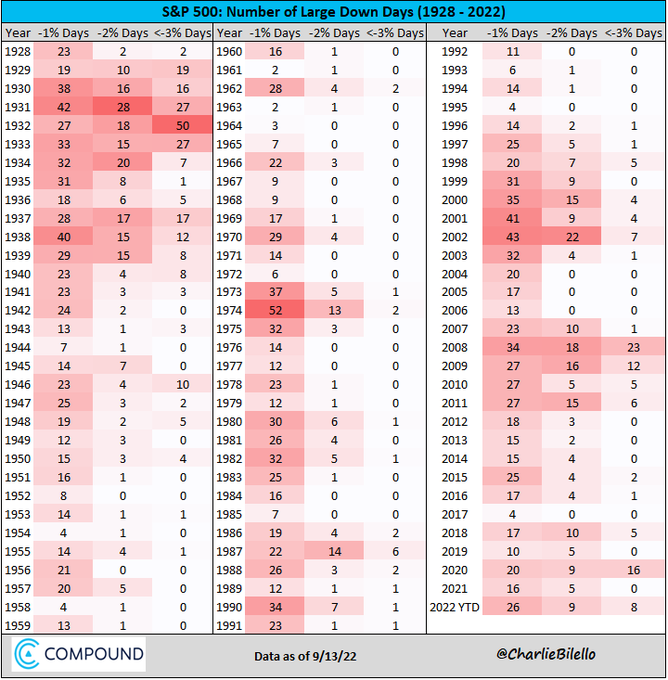
We've now had eight stock market declines of more than 3% this year - so far...
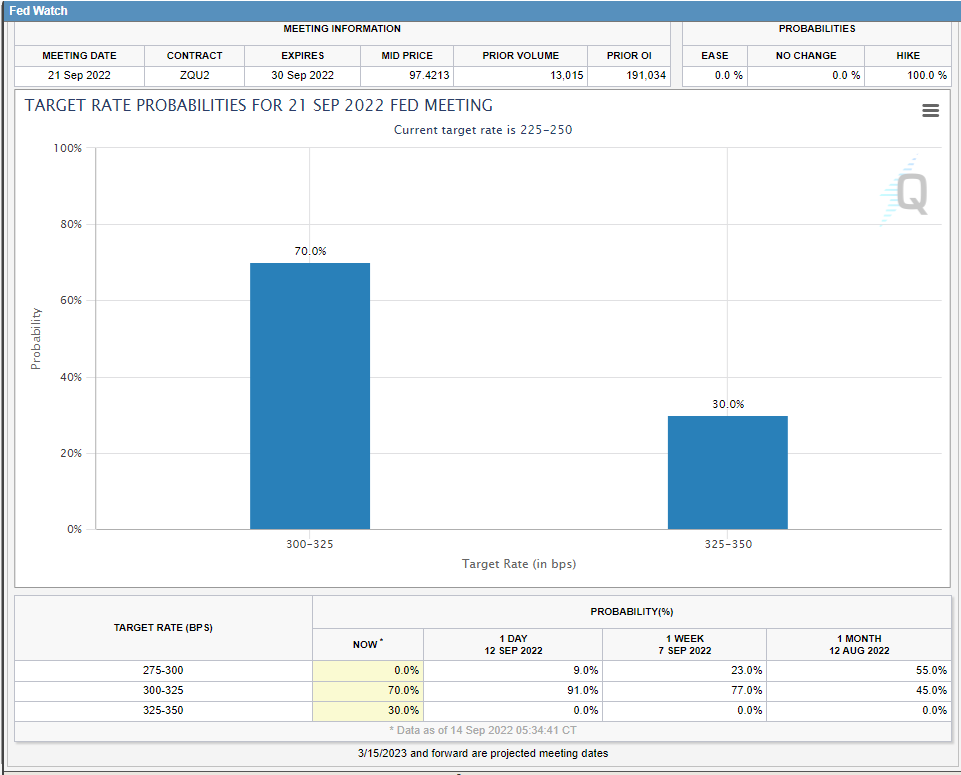
Interest rates are headed higher and probably won't stop until they exceed the rate of inflation as they have in the last eight cycles.
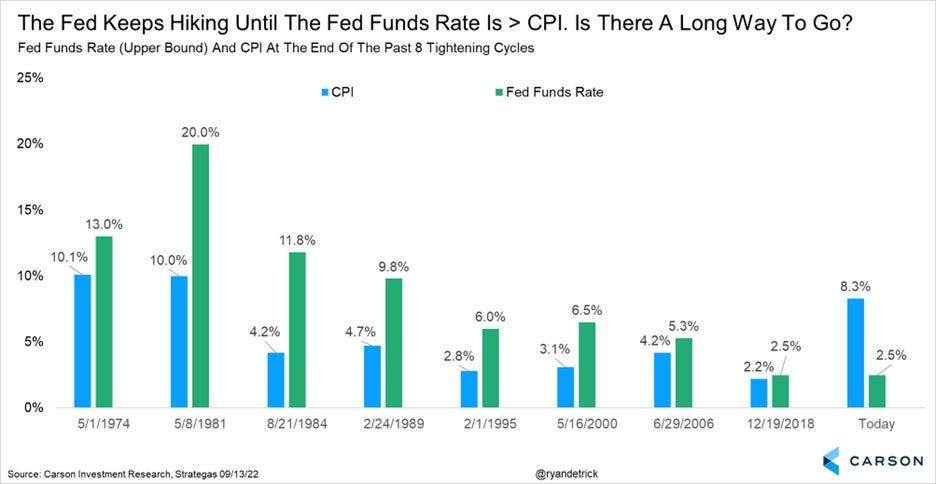
There is a reasonable shot at a 1% rise next week as this morning (9/14) the odds of a 100 basis point (1%) increase has risen to 30%.
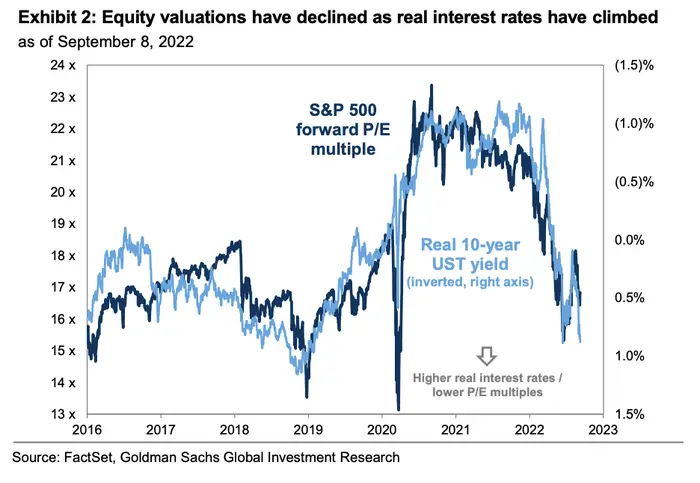
Equity valuations fall when real interest rates rise.
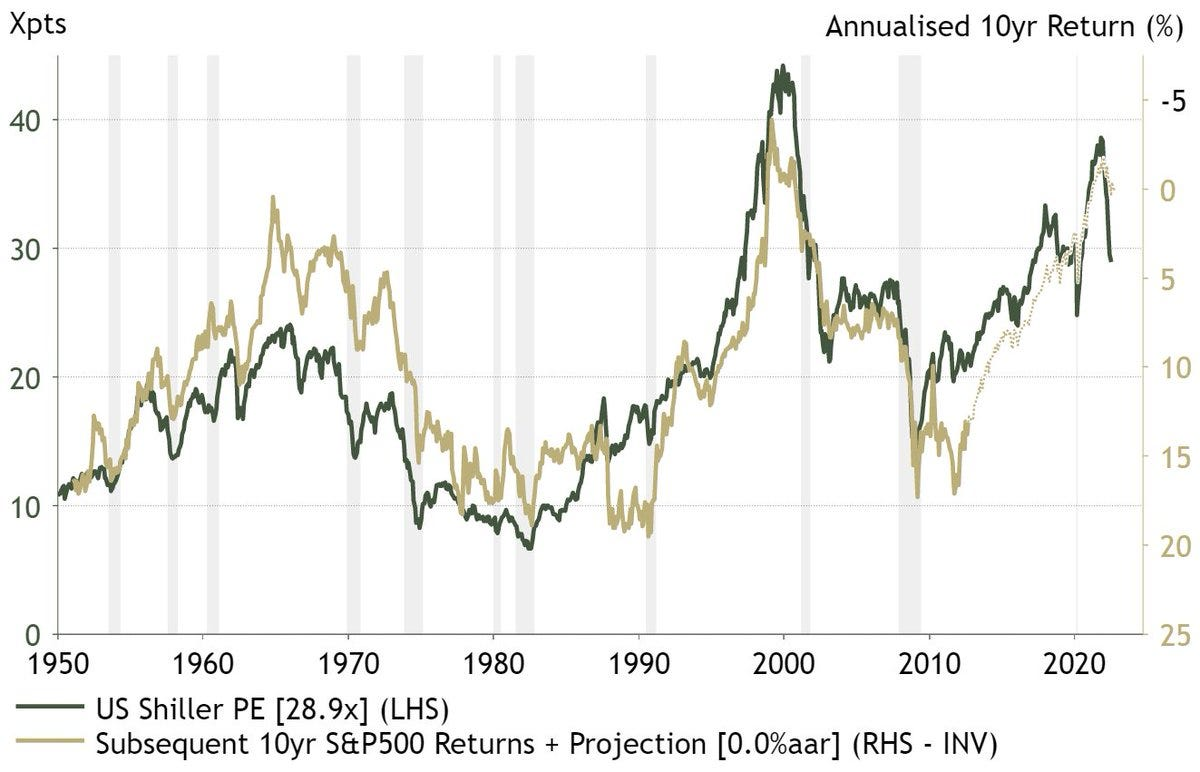
Valuations are still high as this graph of the Shiller P/E shows. (And it suggests returns for stocks could be zero over the next ten years.)
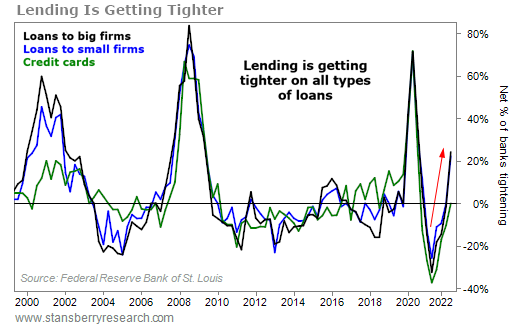
Banks are starting to tighten their lending standards, a red flag for the economy.
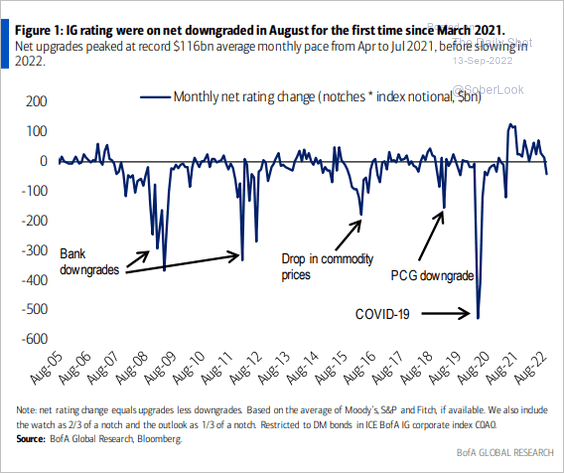
Rating agencies (Moody's, S&P, etc.) are now issuing more downgrades than upgrades for corporate bonds.
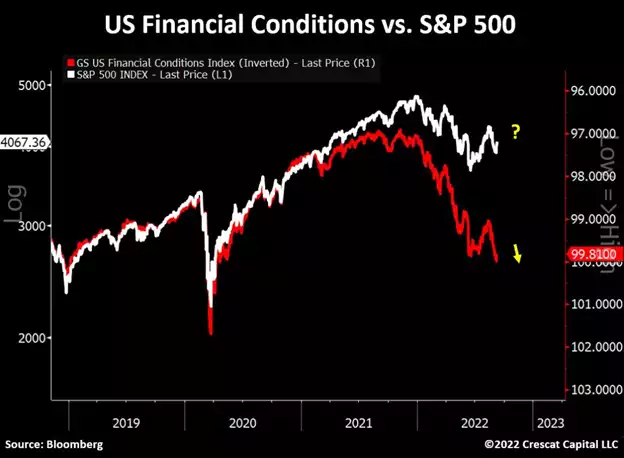
Goldman Sach's US Financial Conditions Index suggests stocks will continue to head south.
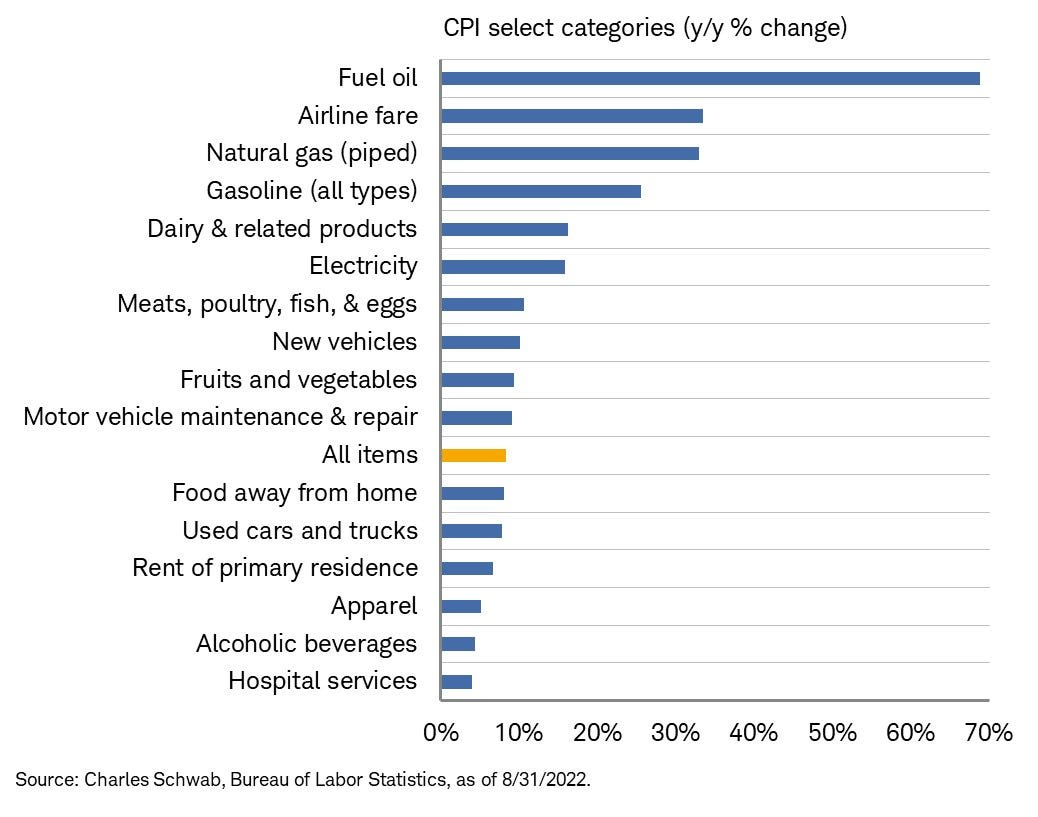
One last look at August inflation broken down by category. Not a good look.
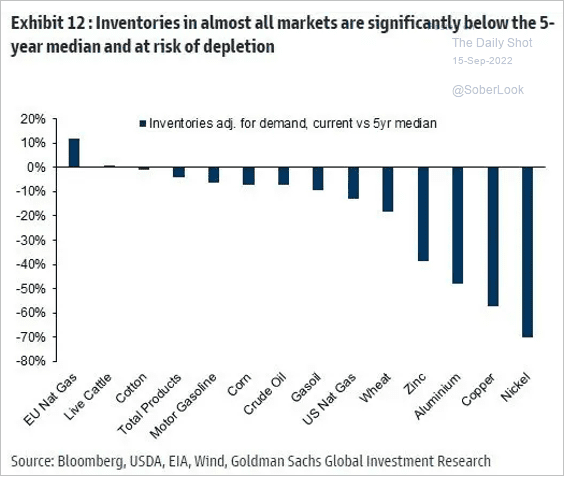
Energy prices have fallen from their peaks but inventories are still below normal. What happens if we have a colder than normal winter? (I think you know.)
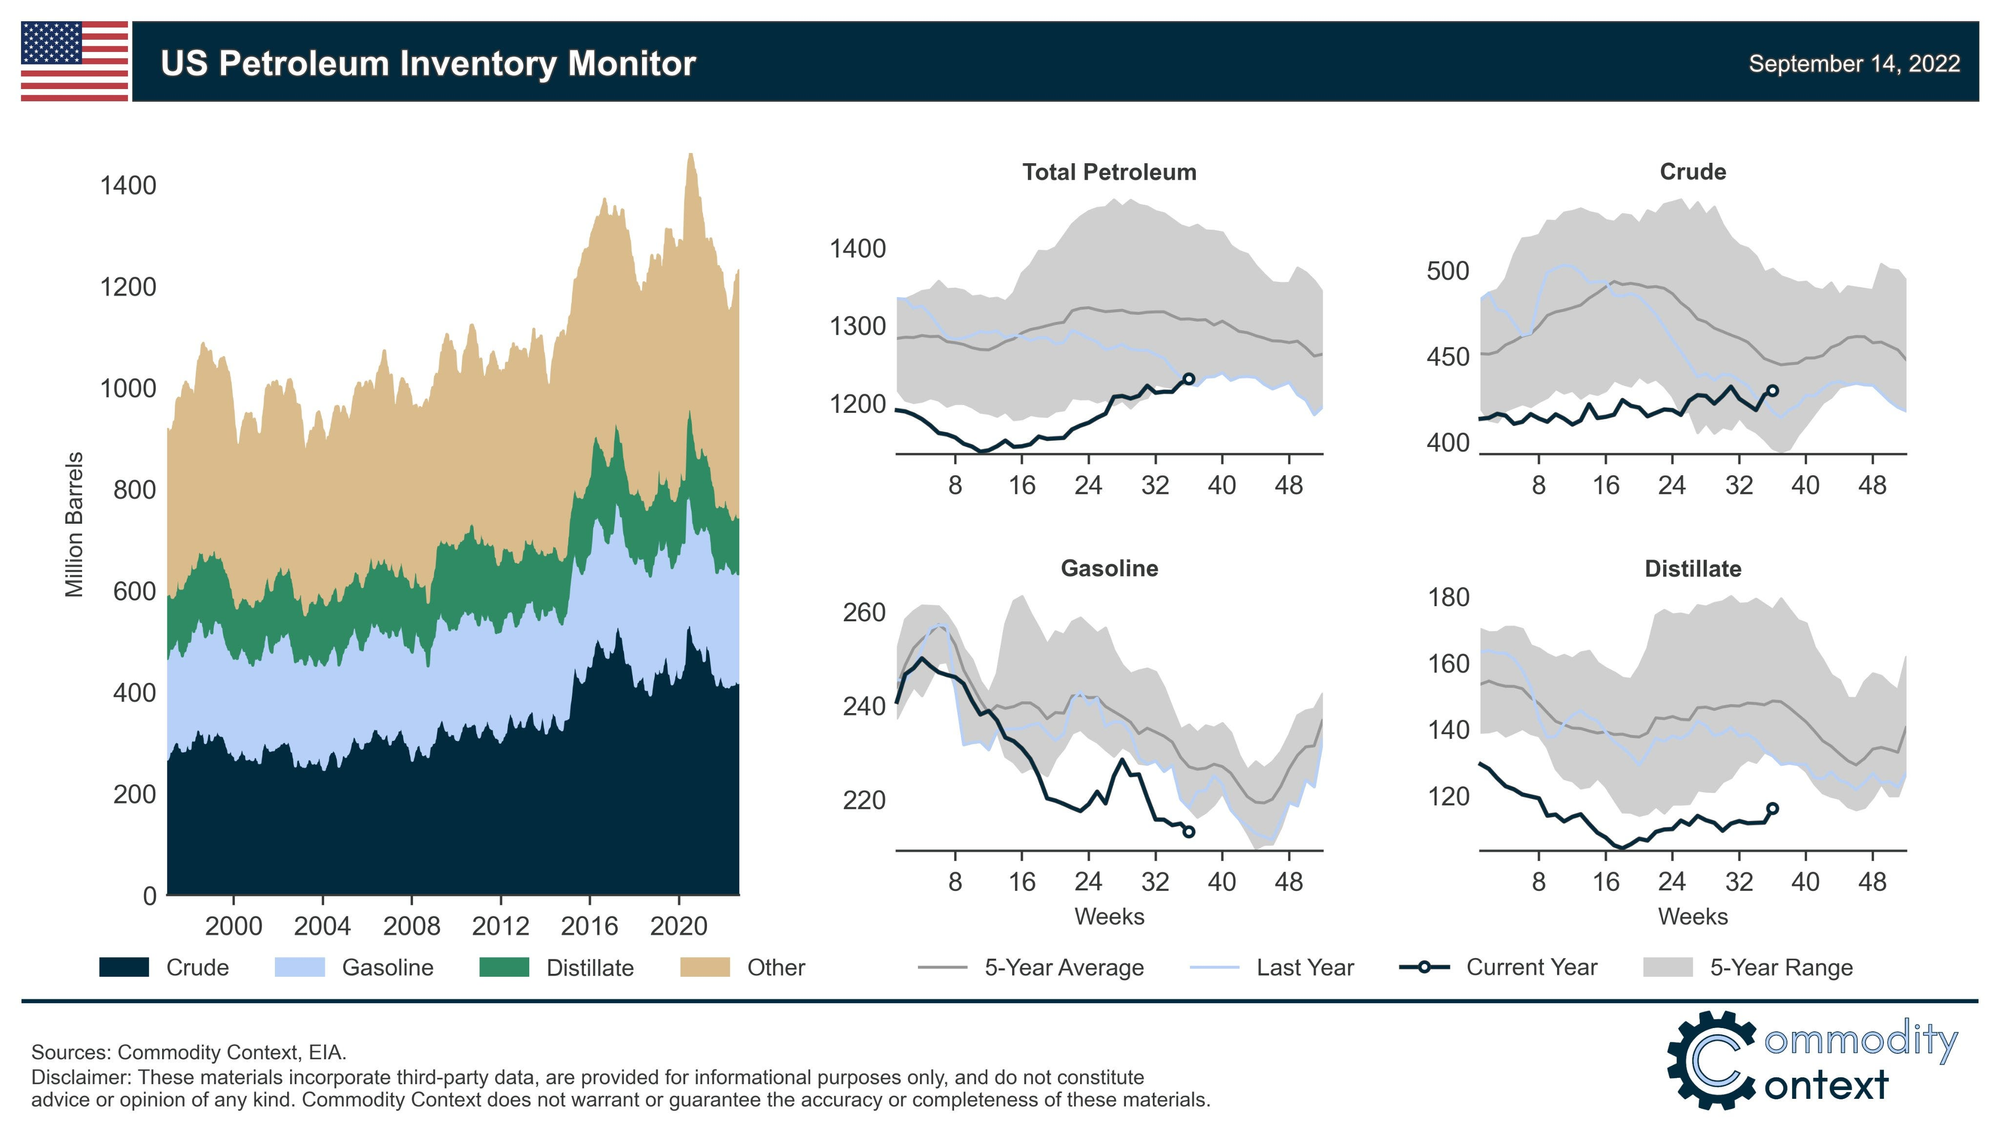
Inventories of many commodities are below average. Don't expect inflation relief from falling commodity prices.
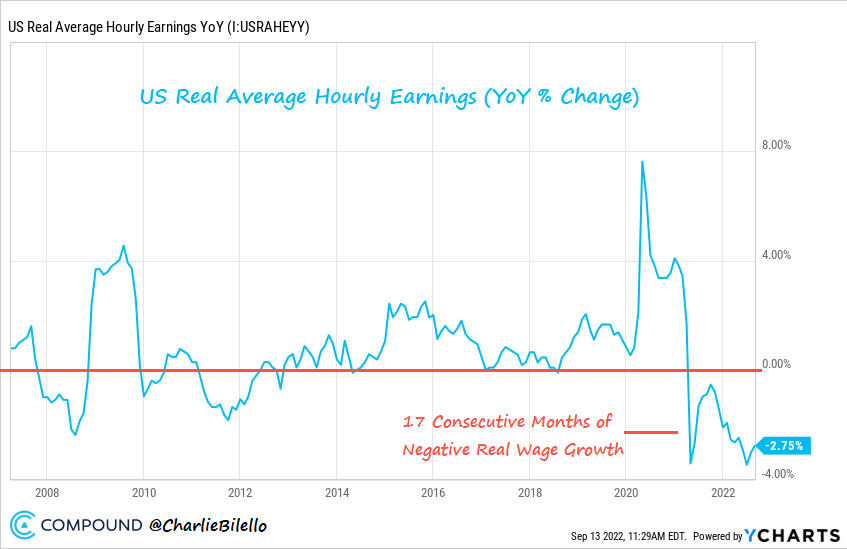
Wages may be rising but they are buying less after inflation.
FedEx shipments were worse than expected suggesting the economy is weakening.
FedEx Issues Massive Profit Warning as Global Volumes Plunge
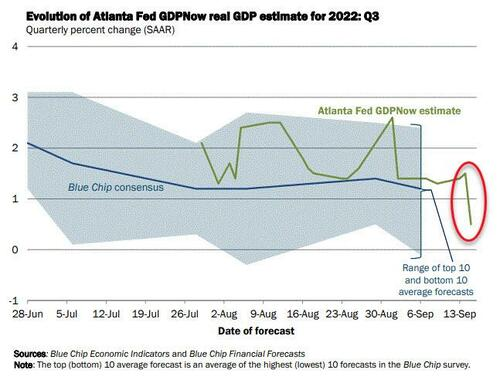
Coincidentally, the Atlanta Fed's GDPNow third quarter forecast plunged to just +0.5% today (9/15).
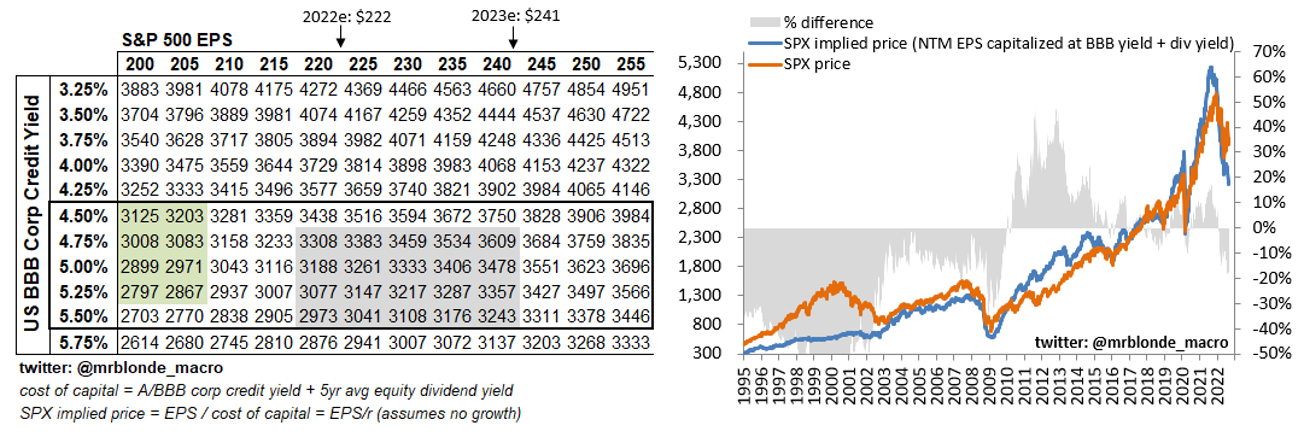
Interesting table of price targets based upon corporate bond yields. Look at the green shaded section for worst-case scenarios and the gray shaded area for a more optimistic forecast of where stocks may bottom.
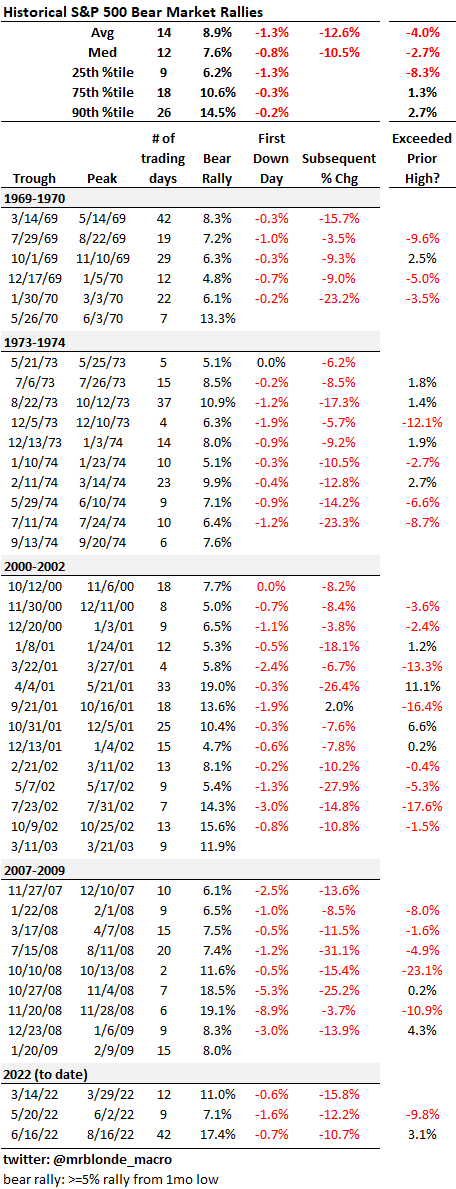
Nice review of bear market rallies. What happened this summer is not all that unusual.
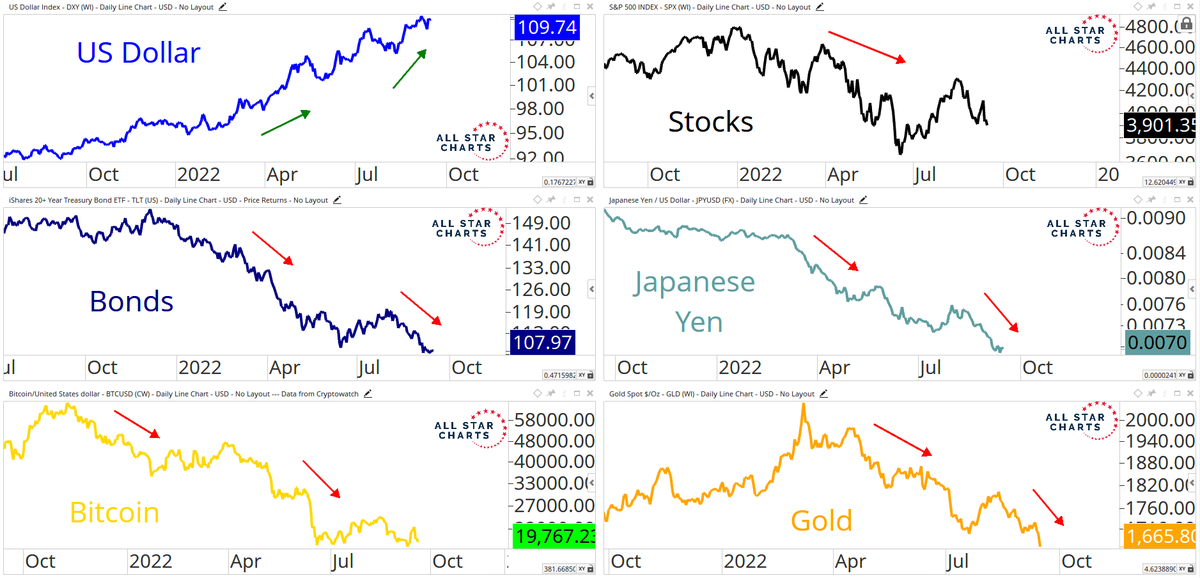
Interesting charts seem to implicate a rising dollar for falls in stocks, bonds, gold, etc.
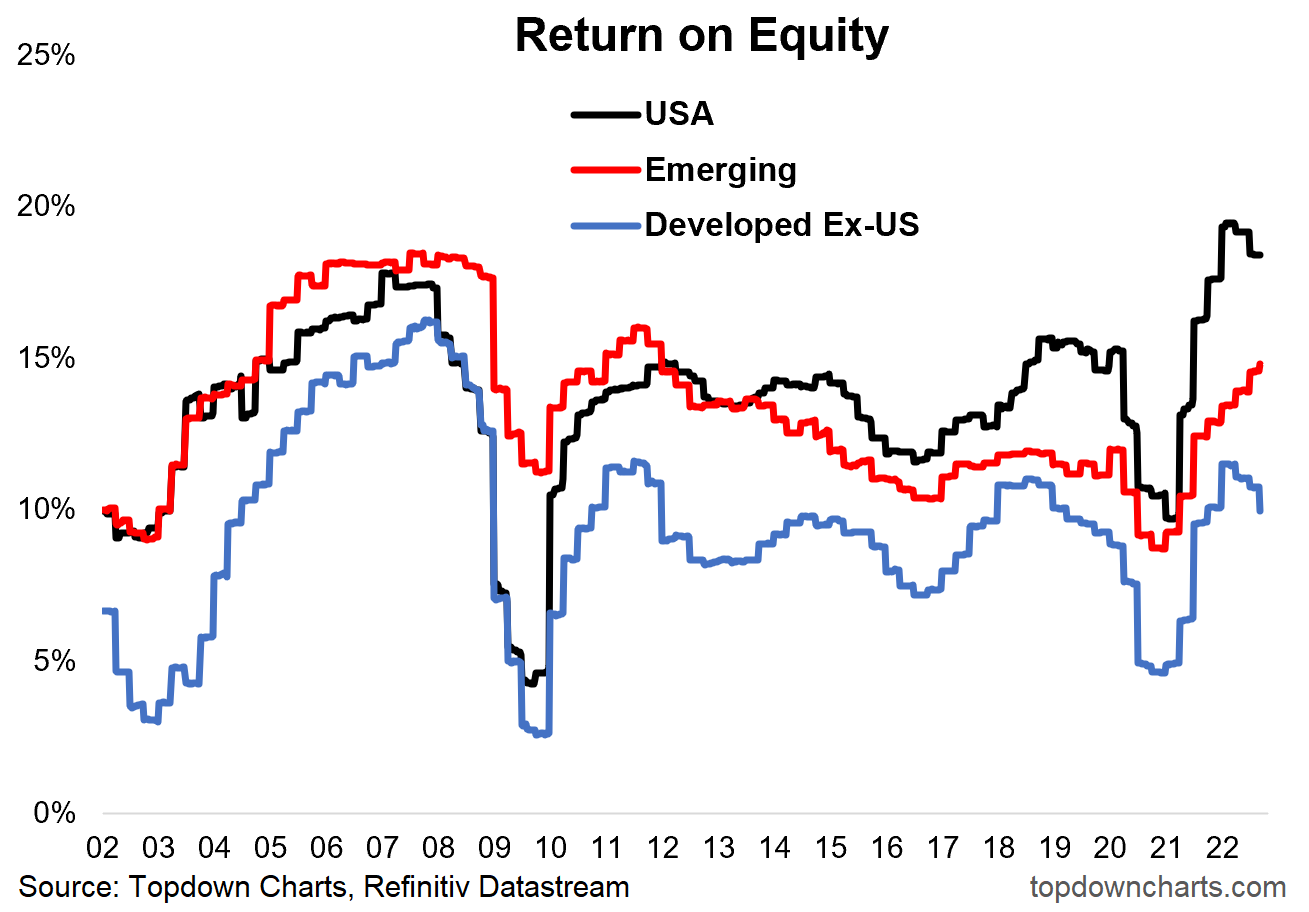
Returns are starting to roll over - not good news for profits
Given all of the above, it should be no surprise that analysts are lowering their earnings forecasts.
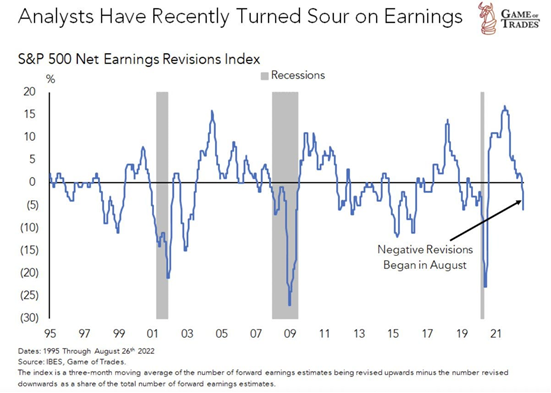
It seems to me falling valuations (e.g. P/E ratios) and falling earnings are not a good combination for stock prices. Just saying...
Thanks for reading! I hope you found something of interest in this week's Chart Attack! Find more Chart Attack!s on the Under A Buttonwood Tree homepage.
Chart Attack! is only available to subscribers of our newsletter, Under A Buttonwood Tree. If you're not a subscriber and would like to be, click the subscribe button and sign up. There is no cost for either the newsletter or Chart Attack! (You can also subscribe on the Home Page.)
If your email box is clogged with too many emails and you would rather read Chart Attack! on our website, just let me know by email and you will be removed from the email list.
Our email address is under.a.buttonwood.tree@gmail.com
Remember, Chart Attack! is only available to subscribers of Under A Buttonwood Tree so be sure to subscribe for access.