September 27 - October 8
I didn't publish a newsletter last week. As a result, there's more to cover. So let's get started!
A Tough September!
Well, the winning streak came to an end with stocks falling about 4.5% during the month. September lived up to its reputation as the worst month of the year for stocks. Here's a recap of asset class returns thanks to CapitalSpectator.com. It looks like only commodities, oil in particular, enjoyed a positive return.

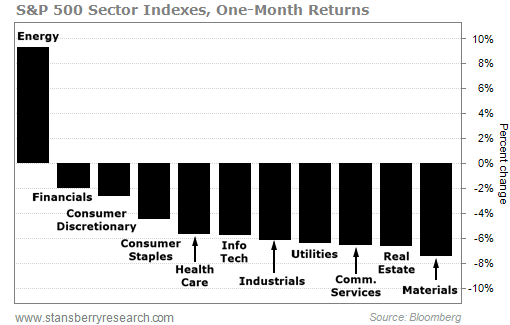
Here's another look at the market's performance last month broken down by economic sector. Not surprisingly, energy was the only positive sector, up 10%. Financials, one of the few sectors that tend to benefit from rising rates, did next best, falling about 2%. Sectors hurt by rising rates such as utilities, real estate, and communications services were among the worst performers.
Although bumpy, October is off to a positive start, up about 2% through Friday, October 8.
If you take a look at the indicators in our Market Lab, you will note some signs of improvement. For example, although not quite positive, the lumber/gold ratio is improving and copper/gold remains positive, suggesting solid demand for these two key commodities (good for stocks). Weakness in long term treasury bonds (TLT) versus intermediate treasury bonds (IEF) also suggests movement away from safe haven treasury bonds into riskier assets like stocks and commodities. Finally, our momentum indicators continue to suggest positive momentum for stocks even after a 5% decline last month. (Remember, to get updated charts/data simply click on the links in the captions below the graph in the Market Lab.)
Combined, I think these indicators suggest the stock market may have some more upside left. However these caveats should be considered: 1. Stocks aren't cheap when you look at the various valuation measures we track, leaving them vulnerable should profit growth disappoint; 2. Interest rates are rising and taxes may as well with potentially profound impacts on equity valuations as we've discussed in previous newsletters; and 3. None of our indicators can predict the impact of an exogenous event (pandemic, war, etc) on the market. With all the "stuff" going on in the country and around the world, I think this is a measurable risk.
Speaking Of Rates...
Have you seen what's happened to treasury yields? Here's a chart of the yield on 10-year U.S. Treasury notes I found in the Wall Street Journal:
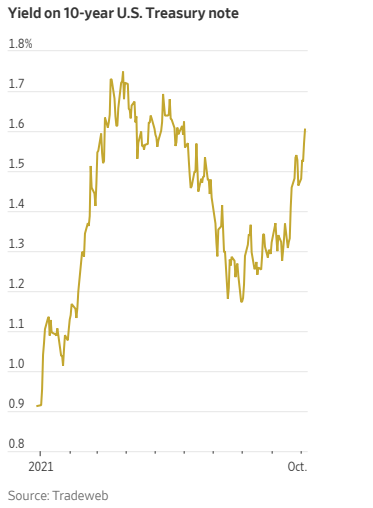
The sharp rise since the end of summer raises concern that a further increase in rates exceeding this past spring's highs would be a problem for stocks as it was in September. Click on the caption to read the article!
Earnings Season Again!
Corporations have already started to report their third-quarter results. I'll do my best to keep you up with the results. So far it looks like this quarter's excuse for disappointing results is "supply-chain". It will also be interesting to see how many companies mention inflation and price increases this quarter. (See below.)
Inflation Watch:
Yet another article from a respected economist/strategist: Stagflation Risk: Stephen Roach Latest Economist to Sound Alarm on 70s-Style Inflation
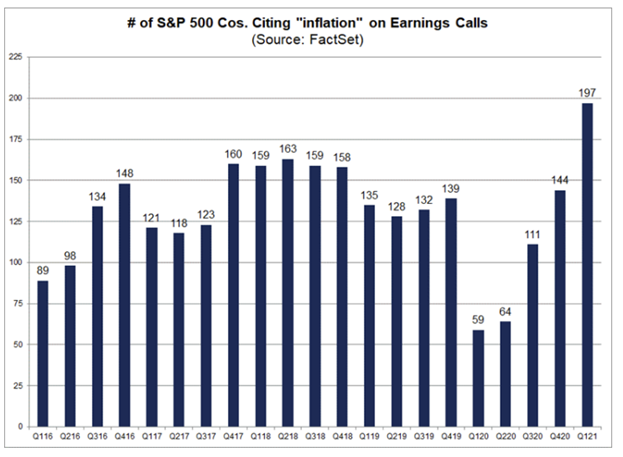
Interesting chart on the number of times companies mention inflation on their quarterly conference calls. Last quarter it hit a new record. Let's see what happens on the third-quarter earnings calls.
A Trick Question:
If I asked you on January 20, 2021, which industry would do better under a Biden administration, renewable energy or oil, how would you have answered?
Take a look at this chart comparing the performance of the iShares Global Clean Energy ETF (ICLN) with the Energy Select Sector SPDR ETF (XLE) since President Biden's inauguration:
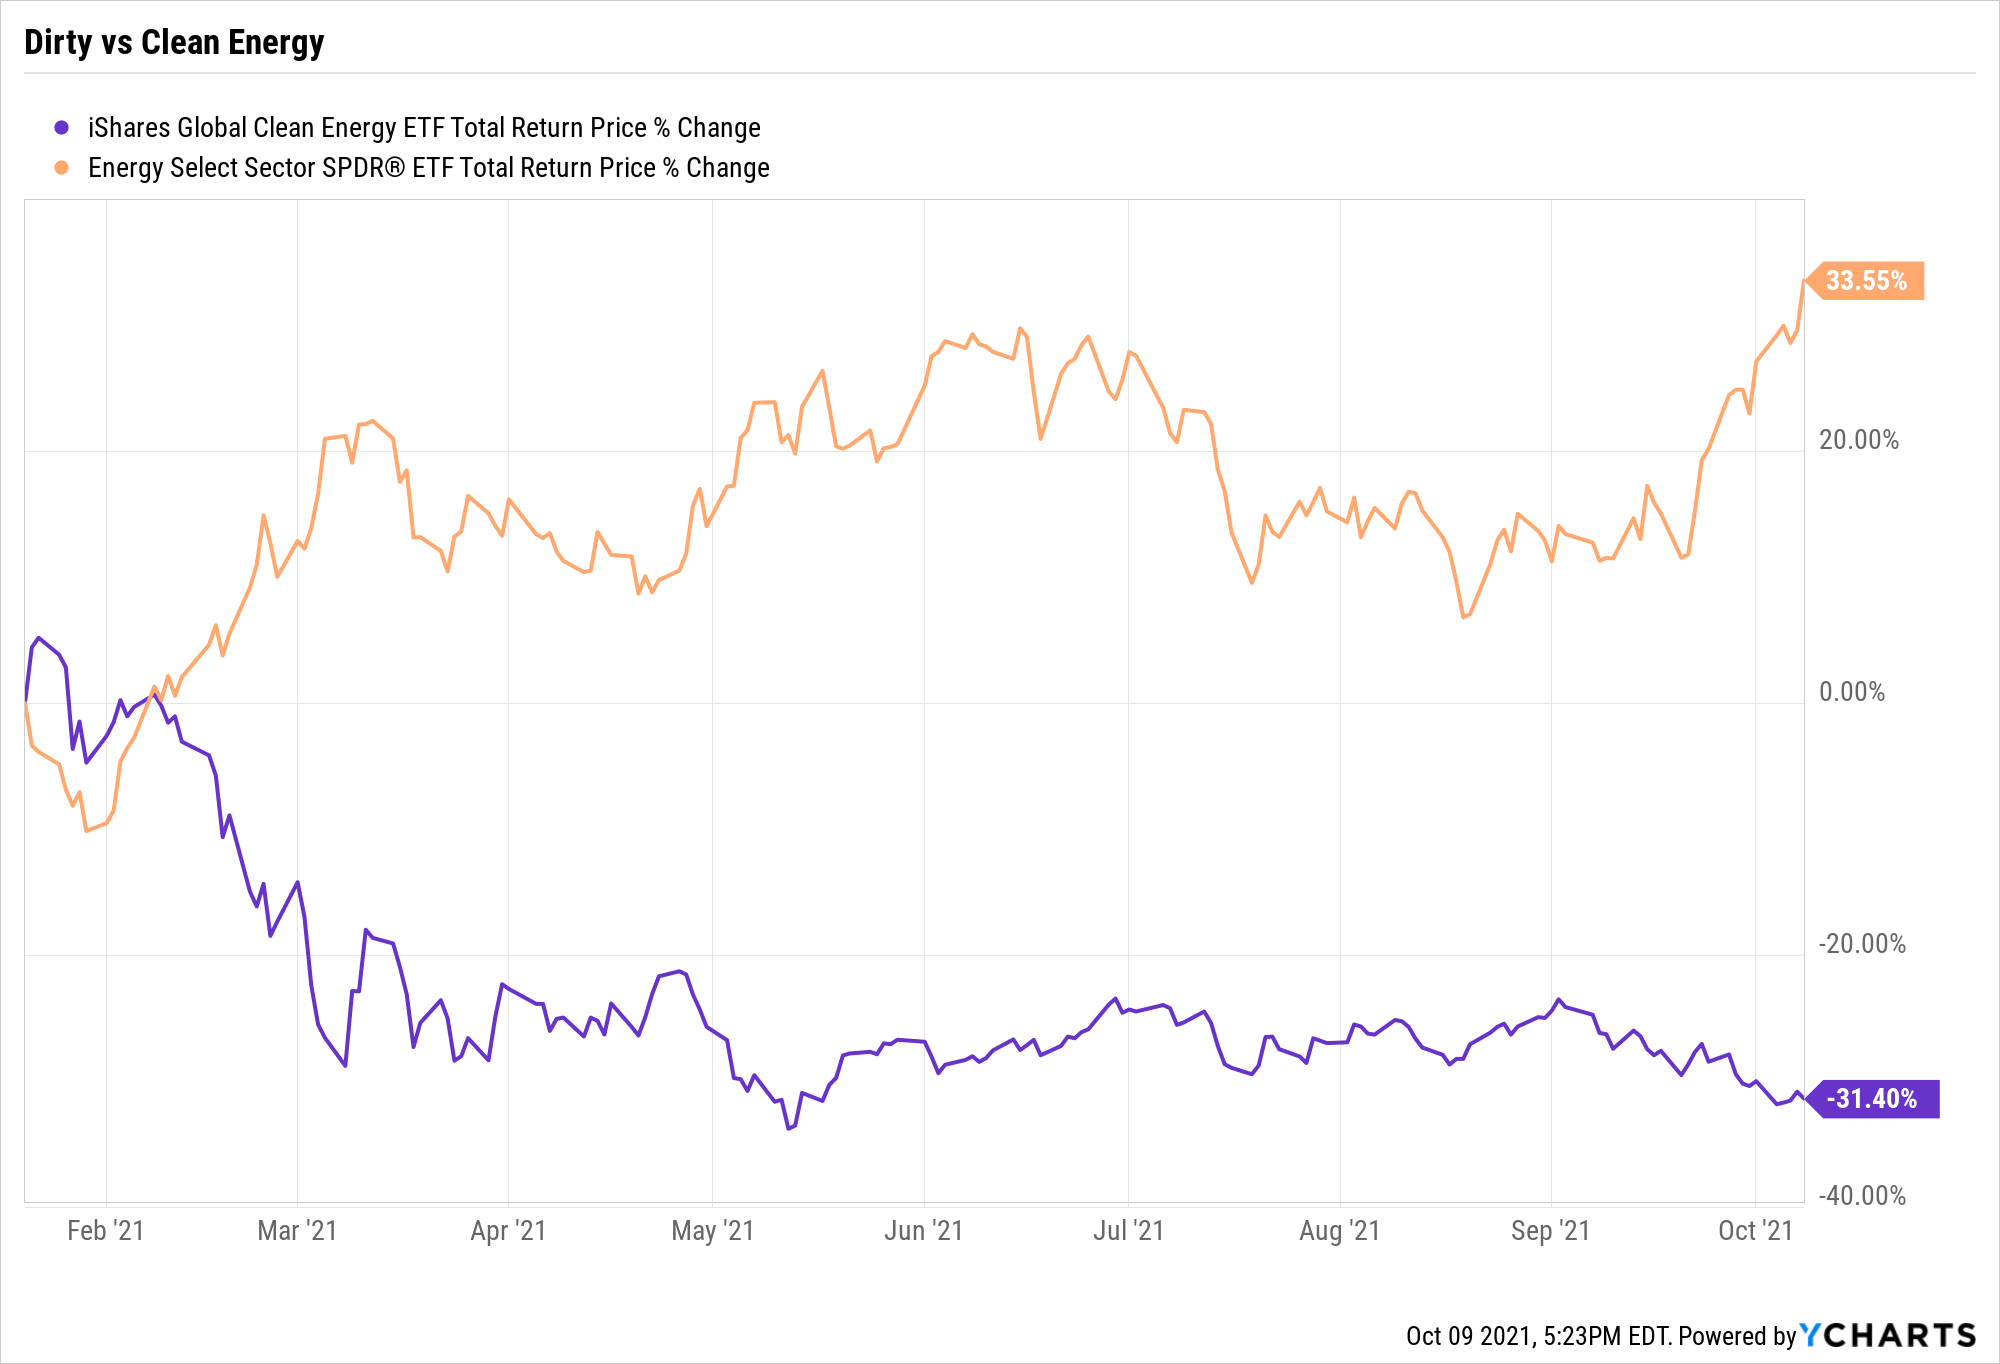
If you answered renewables, you'd be WRONG! In fact, traditional energy stocks, primarily oil and gas, are up 33% since January 20 while clean energy shares are down 31%! Sounds like the "green new deal" turned out to be a great deal for big oil investors. Maybe they should rename it the "black gold deal"!
Just one more example of the danger of making predictions!
The Simple Portfolio:
Back in early August, I introduced the idea of The Simple Portfolio, comparing it to the performance of college endowments. Its simplicity consistently beat out college endowments with their access to consultants, professional investors, private equity etc. Here's a link to that August newsletter, Keeping It Simple, for more information.
I thought I'd give you an update on the portfolio's performance through the end of the third quarter. The table below shows the performance (total return) of The Simple Portfolios 60/40 and 80/20 compared with their three individual holdings (SPY, VEU, BND) and Vanguard's Balanced Index Fund (VBINX).
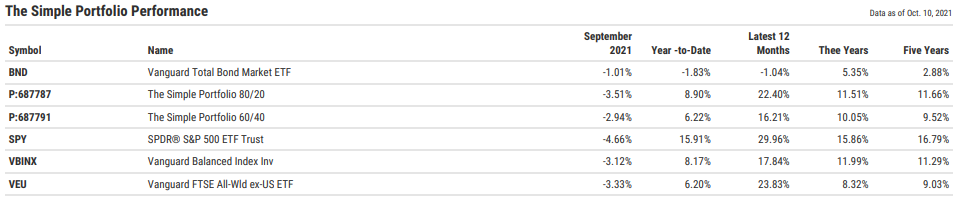
And below is a chart of the year-to-date performance.
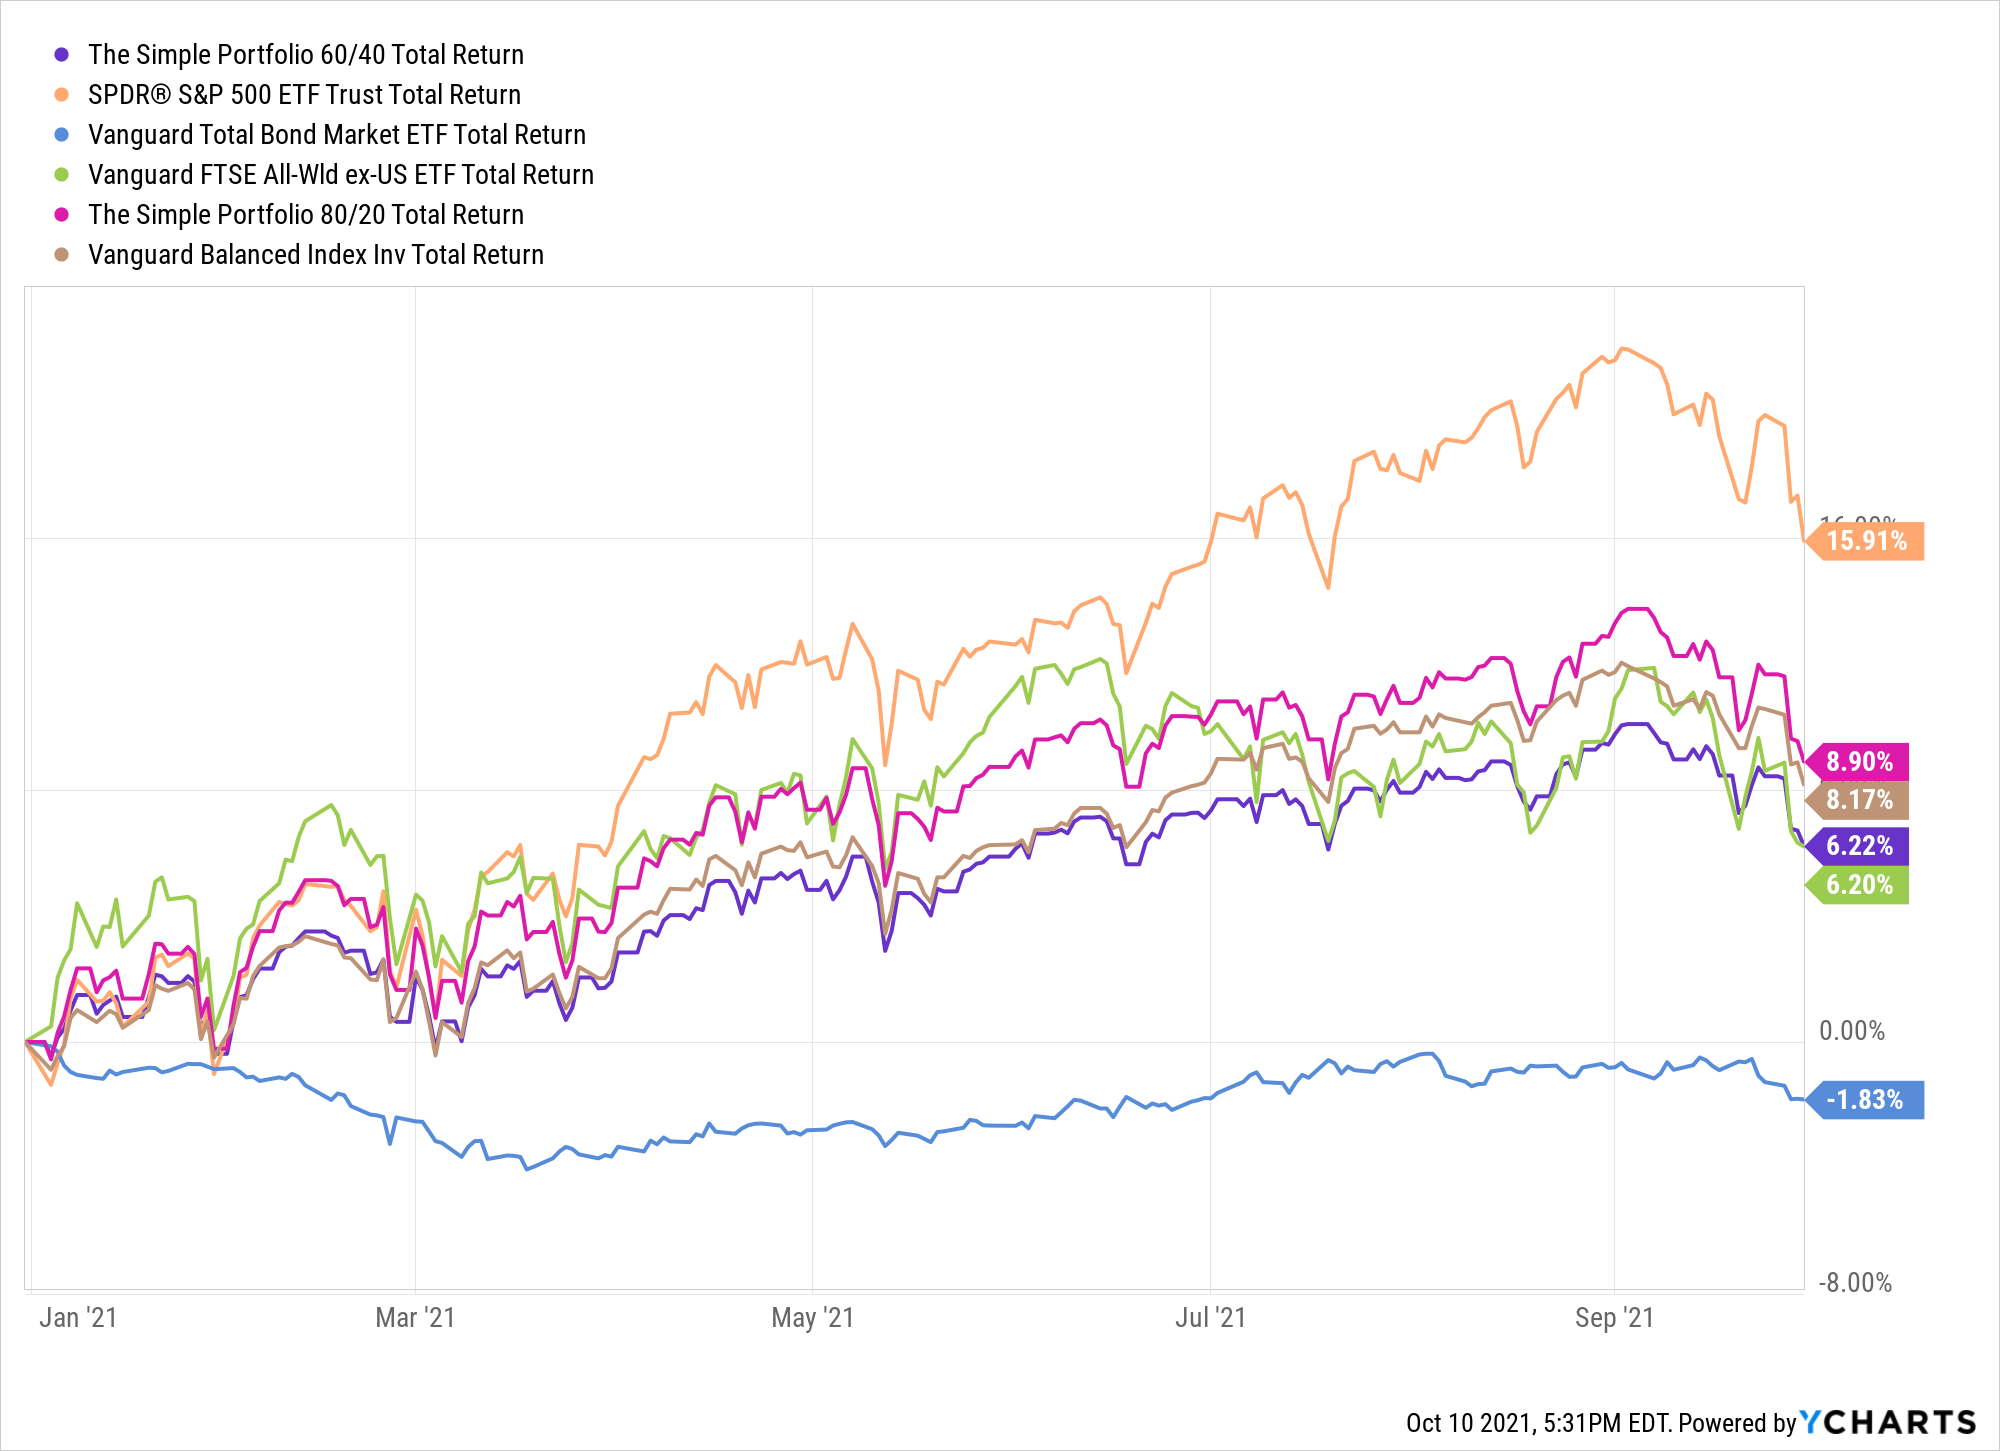
Clearly, the S&P 500 (SPY) has dominated the results of international stocks (VEU) and bonds (BND) for a number of years. As a result, The Simple Portfolios, which are well diversified with the three funds in various proportions have lagged the U.S. market. And, since global stocks have been laggards relative to domestic stocks, The Simple Portfolios have had a hard time keeping up with the domestically focused Vanguard Balanced Index Fund (VBINX). Let's wait and see what happens over the next several months...
From The Garden:
Well, most of the blooms have faded and the leaves have started to turn but there is still some color in the yard. (Click on the caption for more information.)

And Finally...
I'm considering several ideas for upcoming newsletters, including tax loss harvesting, picking appropriate benchmarks, and rebalancing your portfolio. If you have ideas for topics, questions, or comments please email me at under_a_buttonwood_tree@gmail.com.
Please feel free to forward this newsletter to a friend and if you haven't already, you can subscribe on our home page.
Thank you!